
UK Real Estate Update
Real Estate issues are not only a prevalent issue in the U.S., home prices in the United Kingdom fell for the fourth straight month in February, dropping 0.5% from January. Mortgage approval rates remain at the lowest level in nine years as recent rate cuts have not been passed along to mortgage consumers; factors that are likely to cause the continued decline of the housing market.
Similar to the U.S., the U.K. housing boom “powered consumer spending over the past decade”; the decline in real estate prices is likely to cause further consumer economic fallout.
U.K. House Prices Fall in Worst Streak Since 2000
Consumer Spending Stalls
The stall in consumer spending is a likely sign that a recession is in the outlook. Consumer spending accounts for over two-thirds of the economy in the U.S.; the second month of a flat reading is not a positive sign.
Consumer spending stalls in January
Data seen raising new concerns about a possible recession
http://www.msnbc.msn.com/id/23406764/
Who wants this Operating System?
Microsoft plans to cut prices of its Windows Vista operating system with the Service Pack 1 release. Vista has not been well received and still accounts for less than 10% of the installed Windows operating systems. Similar to many others, after experiencing Vista on a PC purchased for my family – my first step was to install Windows XP.
Fortunately, Microsoft will continue to sell Windows XP until June 2008, delaying a forced transition to Vista. Despite hyping the figure of 100 million licenses sold of Vista (many of them uninstalled), and pointing to the strong earnings component related to these sales (many charged for and not used on new pre-purchased systems) – analysts need to start questioning the actual relevance of Vista and if Microsoft will take the necessary measures beyond a price reduction to improve actual uptake.
Microsoft cuts Vista prices to urge upgrades
Friday, February 29, 2008
Quick Takes: UK Real Estate Update, Consumers Stall, Vista Anyone?
Another Rogue Trader: Where is the risk control?
A trader at MF Global caused $142M in losses on “unauthorized wheat trades”. Once again the market is faced with a situation that leaves the majority of the population wondering if any of these firms have even basic risk control measures in place.
Most decent programmers could implement an algorithm that defines financial limits for each individual trader within a firm in less than two days. Creating a financial control system that can not be bypassed is not rocket science. The only conclusion we can be left with is that the majority of these firms actively support traders in pursuing their greed….until they blow up. At this point they become “rogue traders” and their positions “unauthorized”.
Trader at MF Global Rang Up $142M Loss
Rogue Trader at MF Global Rang Up About $142 Million in Losses on Unauthorized Wheat Trades
http://biz.yahoo.com/ap/080228/mf_global_loss.html?.v=4
‘It discovered Evan Dooley, a trader at the company's Memphis, Tenn., branch, trading wheat contracts in amounts that exceeded how much he was allowed to trade.’
He bought as many as 15,000 wheat futures, the equivalent of about 10 percent of the market for these contracts for any given month. In any type of functioning risk control environment this type of order should set alarm bells ringing very quickly. The concept that MF Global only discovered the trades early Wednesday morning and then ran up the losses as it desperately unwound the positions, should make everyone question if the situation is "a mere aberration in our risk control" or a more systemic institutional problem.
Do Mutual Fund outflows spell the market bottom?
Many times ordinary investors are the last to jump on the bandwagon… this is why Wall Street refers to them as “the herd”. Usually these investors are the last to the door after all the professionals and active investors have already established positions.
Mutual Funds are a good representative vehicle of this unsophisticated investor population. The outflows from U.S. equity Mutual Funds in January appear to demonstrate that these investors panicked and headed for the exit door. Over $432.9 billlion was pulled out of equity funds in January, the worst month of outflows since July 2002. In 2002, this month basically marked the bottom of the market with the S&P at 797.70 on July 23, 2002. These lows were re-tested in October of 2002, before the market took off in 2003.
This leads to the question if this behavior once again acts as a signal of a market bottom… or if this is just the start of a severe redemption cycle leading to “cardiac arrest” for the stock market.
Mutual funds markets face long-term outflows
Wednesday, February 27, 2008
Just how bad is the situation with local banks?
The publicly-traded troubled institutions in California with safety ratings of “D” or below include:
- Friendly Hills Bank (FHLB.OB)
- Fresno First Bank (FSNF.OB)
- Folsom Lake Bank (FOLB.OB)
- Fremont General Corporation (FMT)
- Focus Business Bank (FCSB.OB)
- Discovery Bancorp (DVBC.OB)
- Desert Commercial Bank (DCBC.OB)
- Coronado First Bank (CDFB.OB)
- Cornerstone Commercial Bank (CRSB.OB)
- Commerce Bank Folsom (CBFM.OB)
- Bank of Santa Clarita (BSCA.OB)
- Charter Oak Bank (CHOB.OB)
- Bank of Napa (BNNP.OB)
- Atlantic Pacific Bank (APFB.OB)
- Americas United Bank (AUNB.OB)
Florida and Arizona merely have three or less publicly held local banks each with low financial strength ratings. In Florida, the Marco Community Bank (MCBN.OB) and Old Harbor Bank (OHBK.OB) make the list. Likewise in Arizona, the Gold Canyon Bank (GCYO.OB) is an example of an institution with a low financial strength rating.
California stands as an example of the state with an oversized list of publicly traded local banks which have low financial strength rates. This concentration of questionable institutions in a single state, where a large amount of lending has been provided to real estate developers, likely means that a good number of these banks will face liquidity troubles over the coming year as these commercial loans go sour.
Most of these banks are thinly traded on the OTC and putting on a short position may be difficult to implement without excessive slippage in the transaction. The other difficulty is that the majority of these banks have already dropped significantly in price over the past year, in many cases leaving little possible further profit for short-sellers. The most liquid stock, Fremont General (FMT) has already dropped from over $13 to near $2; this bank holding company is already buried in debt downgrades, regulatory troubles, and non-performing sub-prime loans.
Will all of these banks fail – probably not. However in the current economic and credit crimped environment, the risk is leaning in that direction. In California’s Silicon Valley stock option rich environment, executives like to talk about how they “think outside the box”. Looking at the list of financially weak “at risk” institutions in the state, you have to wonder if the entire banking system within California “thinks outside the box”.
California has already been properly depicted as “ground zero” for the subprime crisis. The state was home to dozens of subprime mortgage lenders that imploded; many which appeared to have lax oversight from the state in their greed-driven business. Should there be any expectation that the banks are in any better shape?
At minimum the list above should serve as a warning to depositors that have money at any of these institutions. As outlined in Bank Safety matters more now than ever, paying attention to the financial rating of the institution where you do your standard banking is more important now than any other time in the past years.
Two Days left to Vote
Let your voice be heard....
Now that the 4th quarter earnings are out of the way, is it time to buy banks?
Come add your vote at the top left of the HingeFire blog!
Tuesday, February 26, 2008
Black-Scholes: Is it simply wrong?
The Black-Scholes pricing model has already been battered by corporations that state the model does not properly reflect the pricing of employee stock options. The gripes of many technology companies include the realities that these employee options are not liquid, have long vesting periods, are lost when an employee leaves the firm, and other factors making the value derived by Black-Scholes absolutely inaccurate. This naturally leads to further imprecision and financial engineering in corporate filings – which does not benefit shareholders.
Now Black-Scholes is under attack from another front – the mainstream financial community. Most traders have ignored the Black-Scholes model for years; finding it next to useless in a fast-paced financial marketplace. However the model is still ingrained in the minds of pension administrators, hedge funds manager, and other institutional executives. There is growing evidence that the model is simply wrong, the most significant problem being that Black-Scholes was never designed for any type of extreme market situation.
Is it time to retract the Nobel Prize awarded to Myron Scholes and Robert Merton for their work in creating the model? Nassim Nicholas Taleb, the author of The Black Swan and Fooled by Randomness appears to believe so. Most of Wall Street is not ready to take this extreme leap however. Many are simply hoping for an updated model that can properly reflect risk.
The current Black-Scholes model views that a multi-sigma event will only occur once every million years, in reality market extremes are much more common. With events that can easily wipe out most risk models occurring regularly within eighteen year periods it is clear that Black-Scholes and other models are broken.
The recent sub-prime crisis should serve as an example to the financial community why proper modeling is needed; rather than greed-driven models focused on putting the largest profits into the pockets of Wall Street firms in the shortest possible time period. While a homeowner who lost their home may not understand the modeling of a credit crisis, Wall Street financial engineers should have an understanding of the obvious risks in their products before billions of dollars are taken as losses.
The panic of October, 1987 should have called the relevance of Black-Scholes into question. A model does not work when investors attempt to sell and nobody will buy. When liquidity is lost, most currently utilized models are worthless. Still the Wall Street community clung to the Black-Scholes model.
Most alarming, if Black-Scholes does not properly model options then trillions of dollars' worth of securities have been priced over the past years without regard to the possibility of multi-sigma events in the markets.
More press is regularly appearing in mainstream financial journals questioning the Black-Scholes model; the detractors will no longer be mute. This trickle is likely to become a roar as Wall Street firms continue to take losses over the coming year which reflects their inability to correctly model risk. At some point, Black-Scholes will be relegated to the financial bit-bucket of the modeling past… only leaving the question if will it occur soon enough to avoid additional pain.
Inside Wall Street’s Black Hole
Quick Takes: Home Prices drop 8.9% in 3 months
The housing bubble has firmly imploded... despite nearly 50% of Americans still believing that their home has not gone down in value. The downward spiral will continue during 2008. This period will be listed as the most catastrophic housing decline in American history, likely exceeding the period of the Great Depression. This has been the first time that the entire nation has experienced a real estate bubble. All speculative bubble events eventually end in a similar painful manner, whether it be with tulips, stocks, precious metals, or homes.
"U.S. home prices lost 8.9 percent in the final quarter of 2007, Standard & Poor's said Tuesday, marking a full year of declining values and the steepest drop in the 20-year history of its housing index."
http://news.yahoo.com/s/ap/20080226/ap_on_bi_ge/home_prices
Monday, February 25, 2008
Two New India ETFs
Two new India-focused ETFs have come to market. The WisdomTree India Earnings Fund (EPI) began trading last Friday with over one million shares in volume the first day. The PowerShares India Portfolio (PIN) is expected to launch tomorrow.
Including about 150 stocks, the WisdomTree India Earnings Index has a dividend yield of 1.24% and a PE ratio of 13.99. The top five companies represented in the ETF are Reliance Industries Ltd. (13.35%), Oil and Natural Gas Corp. Ltd. (6.27%), Infosys Technologies Ltd. (INFY) (5.78%), Bharti Airtel Ltd. (3.93%) and ICICI Bank Ltd. (IBN) (3.32%). Energy is the largest sector in the index at 24.88%.
The 0.88% expense ratio of the Wisdom Tree ETF (EPI) is cheaper than equivalent closed ended funds such the Blackstone India Fund (IFN) with a 1.23% expense ratio or Morgan Stanley’s India Investment Fund (IIF) with a 1.30% fee.
Investors should avoid the iPath MSCI India ETN (INP) whose issuance remains suspended due to problems with India's foreign capital restrictions. The new ETF products have been designed to meet these requirements and avoid the type of trouble experienced with the iPath MSCI India ETN.
A whitepaper from WisdomTree about the EPI Exchange Traded Fund outlines this new product in more detail.
Sunday, February 24, 2008
Free Elliott Wave Theorist
Our friends at EIliott Wave International have just released another compelling freebie. They're giving away one of Bob Prechter's most recent Elliott Wave Theorists.
I've read Bob's work before, and his insights are always intriguing and never conventional.
I recommend you take advantage of this special chance to read his publication free of charge. Single issues are normally priced at $29. Go here to get your complimentary issue.
Here's a peak at what's included in the free issue:
- A single chart that delivers more wisdom than a full week of financial television.
- Bob's ideal time frame for a stock market bottom, including a specific target year.
- A second chart called "Prison Break for the Bears" that delivers a piece of news you won't find in the papers tomorrow – or any other source for that matter.
- Are gold and silver the safe havens everyone thinks?
- Two excellent services Bob personally recommends.
- Plus a candid Q&A session with Bob – conducted by the Market Technicians Association – that will tell you why the Wave Principle is the best-suited tool for anyone watching the markets at this juncture.
Friday, February 22, 2008
Bankrupt Cities, Muni failures, and CDS stress
Earlier commentary (see Will State SIV Funds bankrupt local communities?) discussed the stress that rising retirement costs, increasing payroll, and poor investments were placing on local governments. Recent headlines demonstrate this trend including the California city mulls filing for bankruptcy press and similar commentary from communities in Florida. ‘"As of April, we will not have the money to pay employees," Vallejo Councilwoman Stephanie Gomes said in a telephone interview. "It's just projected to get worse and worse.’ This situation is likely to become commonplace in 2008.
Many of these local governments have outstanding municipal bonds. In December the outlook for the muni bond market was discussed (see The Muni Bond dilemma). While a number of financial industry pundits claimed that the muni-bond sector would recover in 2008; the unfortunate reality is that the outlook over the upcoming months is bleak.
The failure in the past two weeks of the muni auction rate market simply underlines the calamity. Morgan Stanley announced the failure to auction the preferred shares for its closed end funds. Many other financial institutions were in a similar position this past week. This will all circle around as higher interest rates for communities as local governments are forced to pay default penalty rates on their muni bonds leading to further financial stress.
Adding to the credit concerns, Bill Gross of Pimco outlined this week that the CDS market is a huge systemic risk. "The conduits that hold CDS contracts are, in effect, non-regulated banks," says Mr Gross. "[There are] no requirements to hold reserves against a significant 'black swan' run that might break them." There is significant risk that counter parties will not be able to pay their obligations if the system breaks down, and the cracks are starting to show. The term “default shock” in now regularly used when discussing this $45 trillion market. ‘Credit default swaps are bigger than the US government bond and housing markets combined.’ Many skeptics view that this non-liquid market is primed for disaster as bond defaults approach historical means with minimum losses of $250 billion expected over the upcoming year.
The credit crisis has clearly spread beyond subprime; the contagion to muni-bonds, commercial CDS, and other sectors is not welcome news for investors. Systemic failure in any of these markets is likely to take down retirement plans and other major institutional holders leaving main street America effectively holding the bag. Investors should take a close look at their fixed rate investments and carefully evaluate their risk of structural failure. Common investments such as fixed rate annuities and other vehicles often hold CDS and other at risk instruments.
Similarly this is a time to cast a wary eye on the Muni Bond market despite the hype from firms that focus on selling these instruments. Investors should avoid pouring new money into muni bond funds or directly purchasing these bonds. Yield-focused investors should be concerned with the structural problems in the auction rate muni market, the failure of insurers, and local government fallout. These problems need to be resolved before the muni sector can be considered safe or viable.
Thursday, February 21, 2008
The TED Spread
The TED Spread is the difference between U.S. Treasury bill yields and yields for Euro deposit contracts of the same maturity as represented by LIBOR. The name derives from "T-Bill" and "ED” (the ticker symbol for the Eurodollar futures contract). The TED spread is used as a measure of investor confidence and is considered to be a leading indicator of stock market performance.
Originally the TED spread was the difference between the interest rate for the three month U.S. Treasuries is contract and three month Eurodollars contract. Since the Chicago Mercantile Exchange (CME) dropped the T-bill futures, the TED spread is now calculated as the difference between the T-bill interest rate and LIBOR.
The TED spread acts as a measure of credit risk and represents the flow of dollars into and out of the U.S. An increasing TED spread indicates increasing risk, while a decreasing spread signifies decreasing risk. A sudden widening of the TED spread demonstrates a flight to quality, and is indicative of a market under stress.
A  recent chart of the TED spread demonstrates the spikes above the 1.5 level which has historically preceded some declines in the stock market. The sudden increase and extreme volatility of the spread shows a market under stress from the subprime credit issues. The spike in the TED spread in late 2007 preceded the January market slide; staging a scenario where the spread acted as a leading indicator to the decline of the stock market.
A chart of VIX during the same period shows strong volatility at the readings bounced between 16 and 31, but was less effective in acting as a leading indicator for the market decline. VIX tended to track rather than lead the market.  Once example is the rise of VIX from 18 to 31 in early January which is virtually in lock-step with the market drop.
Does the Ted spread always act as a leading indicator of an impending market decline if the level rises above 1.5; according to Bespoke the historical record does not demonstrate this strong correlation. It is more important to focus on the volatility and direction of the TED spread as a leading indicator. Huge volatility and a rapid rise to a high level is a more solid leading indicator of credit stress that would lead to a stock market drop than slow changes in the TED spread.
When evaluating market conditions, it makes sense to pay attention to the TED spread. Many times it serves as a much more effective leading alarm than VIX in revealing the potential for downside risk.
On the positive side, the recent decrease of the TED spread to below one is indicative of improving credit conditions and is a green light for stock investors. However with credit conditions deteriorating in other debt sectors (Munis, auto, credit card); investors should watch for rapid changes in the spread which would serve as a warning flag of possible further stock market declines in 2008.
Wednesday, February 20, 2008
Auction Rate Stress Continues: Muni Bond Funds Impacted
As auctions continue to fail many municipalities are getting stuck with paying the default penalty rates. When no bidders emerge, the rates rise to very high levels for these securities which most issuers can not afford. This is likely to lead to a downward spiral of massive selling, a situation which would totally tank the industry.
Are local governments actually under such stress that projects are unlikely to fulfill their financial obligations? Clearly this frightening statement is the markets current take on the situation. The failure of the auctions is not really a reflection of the probable collapse of the bond insurance companies such as MBIA because some of the offerings are not insured. With both insured and uninsured muni bonds failing in the auction; this can only leave investors wondering if the systemic risk is increasing as the chaos continues. It appears that the pervasive fear has caused the collapse of all efficiency in the auction rate market.
A New York Times article points out the Closed End Muni Bond funds are the most impacted vehicle; all 102 auctions related to these securities failed on Tuesday. Despite having default penalty rates set to under 3.5%, the leveraged municipal bond funds will likely to be forced to redeem their preferreds, a situation that does not help the common or preferred shareholder.
This leads to some possible opportunities with leveraged Closed End Muni Bond Bunds. The ETF Connect site provides the capability to view the funds that utilize auction rate markets. Click on the auction rate tab on the right and select all tax-free funds in the screen. The results enable investors to review the recent winning rate and the day of the auction. Many of the rates above 3 percent demonstrate failed auctions with yields now set at the default rate.
Even more interesting is the potential of Muni funds with a large amount of BBB and below debt, whose auctions have not failed yet, to experience downside over the upcoming weeks. The PIMCO Municipal Advantage Fund (MAF) has over 30% assets in low graded bonds while the gap between the share price and NAV price has closed to the smallest discount in over a year. Any adverse event is likely to cause the price to drop despite the fund’s current 5.54% distribution rate.
Both the Van Kampen Muni Trust (VKQ) and Van Kampen Muni Opp (VMO) funds face a similar scenario. Both have over 20% of assets in low rated debt with a share price at the highest level relative to NAV in over a year. Upcoming auctions are likely to fail leaving these funds with potential downside despite their high distribution rates.
Unlike stocks, Closed-End Muni Bond funds don’t tend to move greatly in price. How much potential downside is available for shorts? On Wednesday and Thursday of last week, all of these funds have experienced large down days when the news of failing auctions spread throughout the market (see - More Credit Turmoil: The Muni Auction Rate market freezes). Most dropped 50 cents (4%) or more on an event that did not directly impact these particular funds at this point. As auctions fail on instruments offered directly by these funds, the fund prices should continue to drop. The question being – how much downside is left?
At minimum investors should expect the price to move back to the traditional statistical discount to NAV and then sink below this level. The price for these funds are likely to re-test two year lows as the fund managers struggle to redeem their preferred securities and are apt to reduce outgoing interest payments to the common share holders. The MAF fund is currently priced near $12.90 and the probable target price near a two year low is $12.00 with a likely yield rate rising near 6% after a price reduction. Most of these funds trade only 25,000 shares in volume each day on average, this however is enough liquidity to enable the creation of a short position. Investors will have to determine if the potential reward of approximately a dollar per share compared to the possible rebound risk makes it beneficial to short these securities over the upcoming weeks.
Disclosure: The author does not have a position in any of the equities mentioned in this article. The information provided does not constitute a solicitation to buy, or an offer to sell securities.
Tuesday, February 19, 2008
Quick Takes: Another $50B and some theories to test
Banks hit up the Fed for another 50 billion
Hoping to pour some liquidity into the credit squeeze, the Fed loaned banks $50 billion over the past few weeks. The Financial Times reported that the use of the Fed's Term Auction Facility (TAF) program increased greatly by mid-February.
The Swimsuit Indicator
Bespoke has recently discussed a leading indicator which defines the performance of the S&P 500 for the upcoming year – The Swimsuit Issue Indicator. I am not so clear if the correlation between the Sports Illustrated Swimsuit Issue and index is justified quantitatively. It appears that I will have to study the issue in great detail over the upcoming the weeks to see if the theory is valid... carefully researching all of the reference material.
The Subprime Primer
Finally, a subprime explanation that providers a suitable overview of the situation. The Subprime Primer slide show is a humorous look at the subprime lending fiasco and properly hits the key points. [Note: some NSFW written language near the end].
Monday, February 18, 2008
Quick Takes: Student Loan Auction Rate, CDS, and Condo Market
Auction Rate
The most immediate fall-out of the Auction Rate seize up this past week (see More Credit Turmoil: The Muni Auction Rate market freezes) was the student loan market. The failure left North Carolina and many other states scrambling to find new financing. More than two-thirds of our state’s $3.3 billion in student loans were financed using the auctions. It comes as a shock to many parents that the failure of this structured market may mean that no funding will be available to send junior to college this year. This is another example of the poor risk modeling and greed on Wall Street impacting Main Street.
The News and Observer article “Lenders need new financing: Student-loan providers scramble as key credit market fails” provided some very pertinent observations about the situation.
"The whole notion of a failed auction when I started 10 or 11 years ago was unthinkable," Brooks said. "The same could be said three weeks ago. I'm not sure when -- or if -- they are coming back."
The failure has nothing to do with the authority's credit rating or the value of its assets. Both are strong.
"But it speaks directly to people's confidence and trust in the credit markets," said UNC-Charlotte finance professor Tony Plath.
The failed auction stung some agencies harder than others.
The Michigan Higher Education Student Loan Authority announced Tuesday that it would suspend one of its lending programs after the auctions failed.
The auction rate market situation is not likely to improve in the upcoming months. The obvious result is the suspension of many student loan programs across the majority of states as government entities scramble to obtain new funding sources – the crucial problem being that most of these alternative sources will be at higher cost. This will immediately reduce the amount of available loan money and raise the costs for the students.
Credit Default Swaps
A new word for 2007 was subprime, for 2008 is will be Credit Default Swaps as this market implodes in a manner that makes subprime appear to be minor league. At least this is the growing opinion of many economists and media articles. The latest addition was the Arcane Market Is Next to Face Big Credit Test overview from the New York Times on Sunday. The article points out that the unregulated CDS market is enormous at $45.5 trillion in size, double the size of the stock market.
Worst of all the market is crumbling as participants are finding that many of the players will have trouble paying their obligations. As the default rate rises in the bond market, the CDS market will come under increasing pressure. Similar to subprime, a higher level of risk was never really priced into these structured CDS products. This likely sets the table for another credit market fiasco.
Downtown Condo Market
A mere few months ago, the media was hyping the downtown Condo market as resilient in a down real estate market. Outlining the high prices and large numbers of pre-sold units, the industry extrapolated that this trend would continue leading to more projects being planned. Fast forward to today’s business headline “Condo market goes sour: Demand for downtown units falls victim to troubles in home-sales market”
Developers are busy reducing the number of proposed units, cancelling projects, offering incentives, and trying to assist buyers with financing in a tightening credit market. It is starting look like the market for these over-priced units in downtown Raleigh have gone from gold mine to dust bowl.
Friday, February 15, 2008
More Credit Turmoil: The Muni Auction Rate market freezes
The auction-rate market is locked up tight. Major brokerage firms such as Goldman Sachs is refusing to let well-heeled investors to withdraw money from these securities which were marketed as “safe as cash”. This has left many of these investors furious at being stiffed by the brokerage firms in what has been labeled New Trouble in Auction-Rate Securities.
The auction-rate market is dominated by municipalities and other tax-exempt institutions; this means that the credit crunch is moving over to the muni market. Not only are the bond insurers such as MBIA and Ambac in disarray, the entire market can not price securities in auctions.
These bonds are long-term securities despite being marketed as cash equivalents to customers. The banks hold weekly or monthly auctions to set the interest rates and give holders the option of selling the securities at these times. This week the market totally froze up, nearly 1,000 of these auctions failed. Furthermore the banks also refused to support the auctions as agents of last resort – leaving all the investors wondering if they will ever get any money back.
Now Goldman, Lehman Brothers, Merrill Lynch and other banks are informing investors the market for these securities is frozen. It is doubtful that investors in this market will see any cash in the next few months. The situation further throws a wrench into the health prospects of the entire municipal bond market.
Looking at the credit market problems from a broader perspective, Nouriel Roubini came out with a summary this past Monday that is a must read for all investors - The Rising Risk of a Systemic Financial Meltdown: The Twelve Steps to Financial Disaster.
In this article, he outlines the prospects and dimensions of a downward credit cycle leading to a systemic financial meltdown. The introduction states that “Such a scenario - however extreme - has a rising and significant probability of occurring.” The article moves on to detail the likely outcome of an event that would usually be labeled a severe economic recession.
For today’s simple economic lesson: Squeezing Oranges – Good. Squeezing Credit – Bad
Any questions?
Thursday, February 14, 2008
Home Prices Fall and Foreclosures Achieve New Heights
Investors only have to tune into the evening news to understand that foreclosures are reaching new dismal highs while home prices are quickly diving. A couple of new figures came out recently which reinforce how badly the housing market struggled in the last quarter of 2007.
The National Association of Realtors announced that home prices fell in 77 U.S. Metro areas in the fourth quarter. “The median sale price of a U.S. home dropped 5.8 percent to $206,200 in the last three months of 2007 from $219,000 in the same period of 2006. Prices fell in 77 of 150 metropolitan areas, the most since the group began tracking values in 1979. The decline was 10 percent or more in 16 metro areas, the Chicago-based realtors group said.” Hard to find any upside with this type of report, nor did NAR attempt to provide any. The situation facing the real estate market in 2008 is even more bleak.
The Rust and Sun Belt cities lead the U.S. in ‘07 foreclosures according the RealtyTrac. Of the 100 largest U.S. cities surveyed, 86 reported higher foreclosure rates. Naturally the areas in the country such as California and Florida that lead the country in the real estate boom have some of the highest rates in the bust. The other side of the coin is that cities facing overall economic problems like Detroit landed top spots. Many of the top cities have more than 4% of their homes in foreclosure.
Certainly housing situation is not going to improve much during the first six months of 2008. The slump is likely to cause further turmoil at new inflection points in the economy as the credit debacle flows over into the consumer and auto loan market. Many businesses as diverse as local banks to landscaping firms are likely to be vulnerable in 2008.
Wednesday, February 13, 2008
Local Banks: Time to Short
The recent subprime CDO plague has clearly cut down the stock prices of major banks. However it is the small local financial institutions that have the least financial strength to weather the storm. Many of these smaller banks did not get caught up in the residential loan fiasco because they were not focused on this market. However, the other shoe is about to fall. Many of these local institutions focused their lending activities on commercial real estate development. A good number of these loans to sub-division developers, builders, and commercial property developers are about to turn sour, leaving these small banks holding the bag.
A number of these local banks have holding companies that are traded on the OTC Bulletin Board and do not generate significant analyst coverage. Naturally these banks are lightly traded, many with only a few thousand shares in average volume per day. A candidate list of potentially under-performing stocks over the upcoming twelve months should include banks with the following attributes:
- The bank must do lending in a state or market under tremendous downside housing pressure and significant new development over the past few years (e.g. California, Florida, Las Vegas, etc.).
- The bank must not be more than 25% off of its highs over the past year – need downside price space.
- The bank must have a D or below safety rating.
Fortunately there is a free resource online that allows investors to screen on the safety ratings of banks. The Street.com screener can be found here.
Simply tab over to the Banks and Thrifts tab at the top. Select a state such as California and the Rating to be D (weak) or lower. In this example a list of 99 banks in California are produced. When a bank in the results is highlighted than the full rating summary report for the bank can be downloaded in a link to the right.Not all banks are publicly traded however. So an investor must analyze these results against the banks that offer holding company stocks to the investors on the exchanges. At least two banks of the first 20 on the list generated for California trade on the OTC – Alliance Bank (ABNS.OB) and Bank or Santa Clarita (BSCA.OB). While these two banks pass two of the criteria above, they flunk the third in that they are already more than 25% off their peaks. Many of the candidates may face this issue because the entire financial sector has tanked in the market. The basic idea is to search for local banks that have unexpectedly held up in price despite their safety ratings indicating that they should be in the flusher; these are candidates that may still have significant downside potential and are worth investigating as shorts.
After generating a list of possibly candidates the next step is to read their filing information to determine the level of outstanding commercial loans associated with real estate. The concept is to hunt for the banks that have the largest exposure.
As commercial loans sour, the local banks with large exposure and low financial safety ratings are likely to flounder. A good number of these banks are probably excellent short candidates over the coming months.
Disclosure: The author does not have a position in any of the equities mentioned in this article. The information provided does not constitute a solicitation to buy, or an offer to sell securities.
Tuesday, February 12, 2008
Bank Safety matters more now than ever!
It is more important now than any other time since the Great Depression to pay heed to the safety ratings of the bank where you have deposited cash. A recent article by Reuters outlined how dozens of banks will fail by 2010. During the past 3 ½ years only 4 banks collapsed, this rate is about to go up drastically; this number is expect to increase to near 150 over the next couple of years. Some surveys expect even greater numbers.
Smaller banks with under a couple of billion dollars in assets are most at risk; however the problem could easily spread to larger institutions in a scenario with severe economic and real estate declines.
Fortunately there are services available that allow you to determine the safety rating of your bank. The FDIC website has a listing of the major services. Two of the leaders are Weiss and Veribanc. Both offer information via phone and the web for a fee. The good news is that many local libraries have subscriptions to their information, so it only requires a trip down to your local public library to research the information for free.
Investors should always check out the rating information for a bank before placing cash at the institution. Getting the latest information is especially important in this era of souring real estate loans. It is also important to keep your total deposits at a bank under the FDIC limits so you are insured.
In another interesting note, FICO scores are being overhauled. In an age where the importance of these scores has risen; their ability to determine credit-worthiness has plunged – to the point where FICO scores are almost meaningless. Fair Isaac Corp is promising to completely radically overhaul its methodology to provide a more predictive stat. It is an open question if this will help the lending community. Most industry pundits believe that an altered FICO scoring system would not have stopped the loose lending standards at banks that led to the subprime meltdown.
Monday, February 11, 2008
Trade Stocks for Free: Zecco
Recently I have been taking a look at low cost brokerage firms that I plan to use for multi-day trades. My focus has been on online firms with the lowest cost and best service. An evaluation provided two possible candidates at the top of the list – Zecco and TradeKing.
After taking a look at both brokerages I have decided to go with Zecco. The firm offers ten $0 trades per month. Even better, Zecco has built an active community around their service including forums and blogs. Some of the commentary is very beneficial and interesting for investors.
Come join me at Zecco! Buy Stocks Online for $0. Trade stocks for free on Zecco.com. The Free Trading Community.
Sunday, February 10, 2008
Will 130/30 Funds hold water?
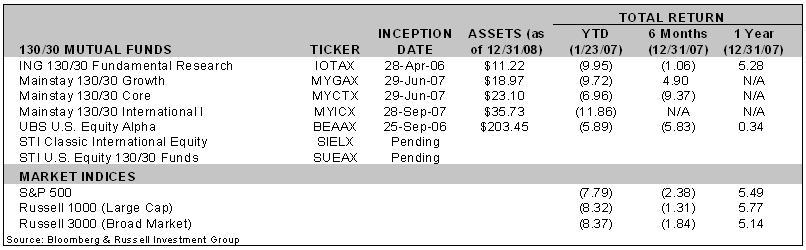
As pointed out in a recent article in Investment Dealers' Digest, 130/30 Strategies are Set to Gain Traction. Hedge funds and major brokerages have been heavily marketing these funds to institutions such as pension funds. The recent tumble in stocks has only increased the marketing blitz and associated claims that these strategies will squeeze out excess alpha in both down and up markets.
As outlined earlier, 130/30 funds allow managers to short-sell up to 30% of their portfolios, and use the proceeds to buy an extra 30% long. The funds both use leverage and short-selling. The current market size is estimated to be $50 billion, many analysts expect the funds in 130/30 products to grow to $1 trillion over the next few years. However it is an open question if these funds actually can deliver on their promises, or are simply a scheme to increase the fees generated for brokerages and hedge funds.
The usual sales pitch involves presenting quantitative back-tested models and presenting results to investors which demonstrate the increased alpha. Naturally these models have the advantage that the managers can easily tweak the selection criteria to provide the results desired over the time frame. The sub-prime CDO fiasco should provide ample evidence that “quant” models that work in back-testing can easily blow up when applied to a real market. The 130/30 models used by fund managers face a similar risk of immediate under-performance.
The stock market performance in January was dismal, NASDAQ was down by over 9.9% and other indexes also suffered significant declines. Most people would assume that the performance of 130/30 funds would shine in this type of environment, and many would be near the top of performance lists. The reality is that the performance of the 130/30 funds in January was effectively lackluster in squeezing excess alpha out of the market. There is no data that demonstrates any type of significant advantage in the market when all the factors are taken into consideration. In fact, the results from publicly available mutual funds with 130/30 strategies show that they have underperformed the indexes as outlined in Verdict Still Out on 130/30 Leveraged Funds at TheStreet.com (a performance table is provided here). This can hardly be considered “squeezing excess alpha out of the market”.
Most institutions would have been better off allocating a portion of their money to short funds while placing the majority of their funds (80%+) in long opportunities; if they wanted to achieve better performance with lower fees. Veryan Allen touches on some of these issues in his 130/30 overview. Most investors would be better sticking to traditional products than using 130/30 funds according to Morningstar.
A number of industry specialists would state that 130/30 funds simply limits the long side returns while holding the fund steady in down markets. Another significant issue is that the fees charged for these vehicles are often over-sized compared to other types of funds that institutions can use to achieve comparable exposure. Obviously, a race is on by large financial services firms to acquire more institutional assets in this down market. The 130/30 funds serve as a compelling story, and also deliver out-sized fees to the large financial institutions. One industry quip stated that the collection of fees for a 130/30 fund are usually 0.53% greater than the combination of simply buying equivalent long and short funds. Pension & Investments Online states that a pension fund typically pays 50 to 75 basis points for an active U.S. large-cap strategy, it pays about 25 basis points more for a 130/30 strategy. PIonline views that 130/30 strategy funds are simply a payday for money managers.
Another industry issue is that long managers simply don’t have shorting experience. Some funds will attempt to bring in money managers on board with this type of experience while others will just pick stocks they view as weak as their short candidates. Simply picking the bottom 10% of screens means that many times the manager is selecting the 10% anticipating a rebound; due to their lack of understanding of the criteria that should define a short candidate near the price peaks rather than troughs. For example, the majority of basic fund screening and ranking strategies would have money managers shorting banks now (when they are likely near their bottom) rather than mid-2007 (when they desperately deserved to be shorted). As outlined in the IDD article, "Shorting is a rare talent to begin with, and it's hard to consistently profit on the short side," says Chris Wolf, managing partner at San Francisco-based funds-of-funds Cogo Wolf.’ It is doubtful that very many of these funds will exceed the 130/30 index defined by Andrew Lo at MIT.
An additional concern is “negative carry”, this is the spread in the borrowing cost required to put on the combination of long and short positions. This cost of leverage immediately creates a negative alpha that the fund must overcome to even arrive at par performance. Thomas Kirchner, the manager of the Pennsylvania Avenue Event-Driven Fund (PAEDX), provides an excellent explanation of this issue in his Negative Alpha is Built Into 130/30 Funds commentary.
In some of the cases, the interest on the combined long-short position goes directly back to the sponsoring institution; the large financial services firms are apt to view this as simply another revenue stream and use it as a mechanism to squeeze extra money out of investors. Nor are the disclosure documents very clear on the size of the payments. This entire situation is definitely self-serving and effectively acts as yet another fee targeting customers.
The combination of high fees, minimal short-selling managerial experience, and interest costs are likely to doom 130/30 funds to be underperforming entities. Certainly the marketing blitz from large financial services entities will drive these funds into institutional holdings such as pensions. However individual investor should avoid these funds, and seek other alternatives to create a properly diversified portfolio that can deliver respectable returns over time in both up and down market conditions.
Saturday, February 9, 2008
Find the best commodity opportunities
A FreeWeek of EWI's Commodity Forecasts is now in progress and ends Wednesday, February 13 at noon Eastern!
If you've participated in one of their FreeWeeks before, you know what to expect. If this is your first time, you’re in for quite a treat!
Anyone with a free Club EWI membership gets complete access to Elliott Wave International's Daily Futures Junctures and Monthly Futures Junctures. Senior Analyst Jeffrey Kennedy scours the markets to find the best commodity opportunities and serves them up to you on three different time frames at no cost!
A free Club EWI membership is all you need to get access to FreeWeek. Sign up for FreeWeek now!
Enjoy your complete FreeWeek access to EWI's Commodity Forecasts!
Friday, February 8, 2008
Tech Holds On (barely)
The fingers of Tech are desperately grasping the edge of the cliff while the economy stomps on its hands. Obviously, the news coming out of Tech recently has not been sunny. Since November, NASDAQ has declined 19.3%, the 20% decline mark usually is considered the official start of a bear market. The reports released during the past couple of weeks have only increased the pain. Infineon cut its earnings forecast causing the stock to drop 14%. Alcatel / Lucent projected more losses and cut its dividend. Google missed expectations causing the lofty stock to drop to near $500. Dell has been shedding jobs as their stock has dropped. Motorola has been struggling and many investors are wondering if the company will be broken up. Intel warned in mid-January. Cisco lowered its guidance for the April quarter in their conference call causing the stock to trade down to $21.25 in after-hours.
The continuing misery has driven Tech investors to seek safety while providing entertainment with illuminating headlines such as Some Analysts See Microsoft As Safe Bet. “Any Tech stock that is going to drop less than other tech stocks must be a good investment, eh.”
Certainly the situation for the first half of 2008 is looking bleak. The HingeFire January survey showed that over 42% of the respondents expected Tech to drop by more than five percent in the first quarter. However at some point investors need to ask if all the bad news has been priced into these stocks. Despite the news from Cisco Wednesday evening, CSCO stock rose in the market by the end of Thursday. Many fundamental investors would point to this as a very positive occurrence in regards to the news, arguing that the price rise demonstrates the strength of the stock and overall tech sector. Technical analysts would simply state that the market was oversold from several days of previous selling and the upside day merely represents a dead cat bounce.
Shares of Cisco have declined 32.3% since November; at some point the valuation will appear to be attractive and buying will start. Certainly there is the possibility of some downside left, most quantitative and technical models show Cisco dropping below $20 in the upcoming months. However if the long term outlook is still for 15% to 17% growth then these prices may represent an opportunity to get some shares at attractive valuations for investors with timeframes over three years. Other large-cap tech stocks are in a similar situation.
Certainly the charts (Charts: The Bad and the Ugly) show that Tech will likely experience some further downside as the market hunts for a bottom. Earlier projections from late October (Quiz: What won’t hold $30) have been right on the money in some scenarios. The question remains if it is time to start hunting for a market bottom in Tech? An initial evaluation shows that any type of bottom may still be several weeks away.
Thursday, February 7, 2008
HingeBear: Ten Underperforming Stocks
HingeBear is a selected list of ten stocks with the likelihood to underperform the market over the next 12 months.
A couple of earlier articles outlined stocks with a bullish case (Five Smallcaps Primed to Soar / HingeBull: Five more outperformers). This summary focuses on the opposite angle, stocks that investors should spurn from a long position perspective. While some of these stocks are in industries such as homebuilders that have rallied off of 52 week lows in the past few weeks, these particular stocks are likely to underperform their peers over the next 12 months. If you want exposure to these sectors then there are probably better upside candidates available.
These stocks were initially found using the HingeFire stock screener to search for stocks with struggling fundamentals and price declines over the past year. Further comprehensive assessment revealed poor balance sheets and declining growth outlooks, factors which will probably lead to underperformance over the upcoming year.
A number of these stocks appear to have limited downside left and may not be appropriate short candidates. A few of them have the potential for the second shoe to drop leading to further price declines.
The following stocks are included in the initial HingeBear list:
- ALTU (Altus Pharmaceuticals Inc.)
- AMGN (Amgen Inc.)
- C (Citigroup Inc.)
- HOV (Hovnanian Enterprises Inc.)
- LNY (Landry's Restaurants Inc.)
- MRVL (Marvell Technology Group Ltd.)
- MBI (MBIA Inc.)
- SLM (SLM Corp.)
- WM (Washington Mutual Inc.)
- RT (Ruby Tuesday Inc.)
Further brief commentary about each is provided below:
Altus Pharmaceuticals Inc. (ALTU)
Altus Pharmaceuticals, Inc., a biopharmaceutical company, engages in the development and commercialization of oral and injectable protein therapeutics for gastrointestinal and metabolic disorders.
Altus has roughly $150 million in net cash, yet it burned through $45 million in capital over the trailing 12 months. In December, the company lost a partnership agreement with Genentech for its hormone replacement therapy, ALTU-238.
While the company has rebounded from its low near $5 so far this year, the future outlook is not all that bright. There are better alternatives in the Bio industry for consideration as an investment.
Amgen Inc. (AMGN)
While AMGN beat the 4th quarter profit estimates, it had flat earnings and lower sales. The sales of many drugs are dropping off rapidly for the biotechnology giant. There is nothing in the upcoming forecast which demonstrates that Amgen will match either the market or sector performance.
Citigroup Inc. ( C )
CDOs anybody? This banking giant is in trouble for its inability to control risk. It is now in the position of wandering hat in hand to international sovereign funds looking for a bailout to meet capital ratios.
There is the possibility that the banking sector has bottomed out after the fourth quarter earning reports. However Citi is unlikely to perform better than the other banks during a sector recovery.
Hovnanian Enterprises Inc. (HOV)
With the housing sector in free-fall, nothing looks good in homebuilders. Hovnanian is one of the homebuilders with the weakest balance sheets and numerous impairments. Even if the sector recovers, Hovnanian is not expected to keep up in price appreciation. In fact from the straight-forward math, the company may face liquidity problems over the coming year unless sales increase – a scenario which is not likely in 2008.
Landry's Restaurants Inc. (LNY)
Decreasing sales, poor ratios, and financials that Moody’s downgraded to a “negative’ outlook on debt ratings in December. There is no information for this restaurant operator that can be described as promising. One recent twist is that Landry's boss, Tilman Fertitta, has recently proposed buying the remaining 61 percent stake in the business to make it a private business; it is not known if this proposal will pan out.
Marvell Technology Group Ltd. (MRVL)
Executive suite turmoil, losses, and no uplifting news. There appears to be no angle for this mid-cap chip maker that would provide any indication that it will match the overall performance of the market.
MBIA Inc. (MBI)
MBIA is a troubled bond insurer with a large SIV insurance exposure in the subprime mess. William Ackman of Pershing Square Capital Management recently outlined to regulators that MBIA still has an additional $12B of CDO exposure that has not been properly disclosed. The firm is desperately hoping that either regulators or an acquisition will bail it out. If one of these scenarios does not play out then it will liable be priced in the pennies like fellow insurer ACA Capital. If some sort of plan is arrived at then the stock price may increase from current levels.
SLM Corp. (SLM)
Sallie Mae can use an education on how to produce profits and run a fiscally responsible operation. This education financer has a long list of problems in the press over the past year and the situation is not expected to improve moving into 2008.
Washington Mutual Inc. (WM)
Washington Mutual is a large bank with a long list of troubles. It’s cousin Countrywide was recently purchased by BoA for pennies on the dollar. JPM Chase is currently mulling the acquisition of WaMu according to most press reports. If the bank does not get acquired then it is apt to sink further. On the other side of the coin any announcement about being acquired will likely elevate the stock.
Ruby Tuesday Inc. (RT)
Ruby Tuesdays recently cut its 2008 earnings outlook. This is on top of a second quarter earnings report (2008) showing same-restaurant sales decreased 10.8% and 8.7% at company-owned and domestic franchise restaurants. The statistics demonstrate falling revenue and earnings. Sometimes there is a reason that a trailing P/E of 7 does not represent value. There is nothing in the Ruby Tuesday’s information which would recommend it as an investment which will match market performance.
Disclaimer: The summaries provided at the HingeFire blog should not be construed as official investment advice.. You should see a qualified investment advisor if you need direct advice about your individual financial situation. The information provided does not constitute a solicitation to buy, or an offer to sell securities. The author does not hold a position in any of the securities outlined above.
Wednesday, February 6, 2008
Banks Behaving Badly: Wachovia
Wachovia has always had the reputation locally of treating customers badly; most people in the area have labeled the bank “Walk-all-over-you”. However it appears that Wachovia has even sunk beyond the low expectations of the community in its latest fiasco – which involved actively participating in the defrauding of its own customers in order to generate fees. This may be the event which sinks the reputation of consumer banking to a new low.
Wachovia allowed fraudulent telemarketers to use the bank’s accounts to steal millions of dollars from unsuspecting victims – in many cases the victims were their own customers. Furthermore the complaints state that the bank even possibly went further in providing account information to questionable telemarketers which allowed these scam artists direct access to customers’ accounts for fraudulent purposes.
Even worse, many of the victims were elderly. Wachovia accepted fraudulent, unsigned checks that withdrew funds from the accounts of victims. “Wachovia forwarded those checks to other banks that were unaware of the frauds, which in turn sent money to the swindlers.”
Why did Wachovia support these scams - because they were making a ton of money in fees. The bank charged fraud artists a large fee every time a victim spotted a bogus transaction and demanded their money back. “One company alone paid Wachovia about $1.5 million over 11 months, according to investigators.” In fact records demonstrate that the bank actively recruited telemarketing companies it knew had been accused of fraud. Wachovia was not only aware of these crimes but actively supported them as a string of internal emails demonstrate.
Sadly, Wachovia and most other banks accused of involvement in similar frauds have never been publicly fined or prosecuted by federal regulators for aiding telemarketing criminals. Well hopefully the civil lawsuits will at least recover some of the money for victims, and make banks aware that these types of abusive practices are unacceptable. Maybe is it time for the State Attorney Generals to step up and prosecute the offending banks, seeing how the federal government has been ineffective in stopping this fraud.
Papers Show Wachovia Knew of Thefts
The “R” word
The “R” word is now all over the news. Two months back it was rarely mentioned, now it seems to be at the top of every financial section. Even the Fed is getting into the act with Jeffrey Lacker, the president of the Richmond Federal Reserve Bank, citing the risk of a "mild recession” when discussing interest rate cuts.
A growing number of economists believe that recession has arrived and it started in January. Some economists are being quoted as there is a 75% chance that a recession began in January. Unfortunately the National Bureau of Economic Research (NBER) is always behind the curve, and never declares a recession has started until the country is well into one – or in many cases out of one. The recession watch can now end. It's already here.
The recent economic data appears to support the assertion that a recession is underway. In news touted as “dire news for the economy”, the U.S. Services Industry index shrunk at the fastest pace in seven years. The index fell to 41.9 from 54.4. Figures from Europe also show a significant slowing across the Atlantic. The unemployment news is not much more promising; jobless claims are rising each week. Productivity has slowed by 6% while labor costs rose by 2.1% in the last quarter of 2007. This will most likely lead employers to further cuts jobs and slow hiring.
The U.S. consumer which holds the key to two-thirds of the economy is losing confidence. The concern over the economy is the highest in years, with more than 8 in 10 Americans describing the situation as “not so good” or “poor”. This has driven Americans to start doing something that has been unthinkable in past years, pay as they go and avoid credit. Of course living within your means will not help jump start a consumer-driven economy; however the mindset is a refreshing – and long overdue – change.
These morose conditions have led Wall Street to expect another half point interest rate cut in mid-March. The market seems to rally and drop on this type of news. The reality is that any rate cut would take over six months to work through the economy and help corporate bottom lines.
This leads to the question if the markets have priced a recession into equity prices with the expectation that earnings for the first six months of 2008 will be painful. If the “R word” is already priced in then is the market at a point where investors should consider buying in. Are the indexes near a bottom? One side of the coin would say that the P/E ratio for the S&P500 would need to be down near 10 to indicate exhaustion. Some technical traders would state that the violent drops, mini-rallies, high VIX, and re-testing of lows in the recent weeks portrays a market seeking the bottom before staging a rally. Maybe the constant harping of the press on the “R” word is the sure sign of the bottom.
Only time will deliver the final testimony on where this market will go. In the meantime all of this confusion has driven John Mauldin to ask What Does A Recession Look Like?
Tuesday, February 5, 2008
Tax Time is Arriving Again
After the holiday season comes tax season, and unlike Christmas it is not everyone’s favorite time of the year. The blistery winter weather is a proper backdrop as everyone collects their financial data and completes reams of forms.
On the positive side a number of good articles always pop up this time of year that can help you in completing your taxes. A couple of good articles about some deductions that you may not have considered are provided below. Everything from tax deductions for military reservists travel expenses to $250 educators' expenses are discussed.
The 13 Most Overlooked Tax Deductions
http://finance.yahoo.com/taxes/article/104297/The-13-Most-Overlooked-Tax-Deductions
10 tax laws you gotta know
http://biz.yahoo.com/brn/080130/24360.html
The Alternative Minimum tax impacts many upper middle class households; a good overview of the AMT tax can be found at:
The Alternative Minimum Tax -- Not Just for the Wealthy
http://finance.yahoo.com/how-to-guide/taxes/12810
Monday, February 4, 2008
Get Free Daily Commodity Picks
Elliott Wave International (EWI) is once again offering a free week of commodity picks and information. A FreeWeek of EWI's Commodity Forecasts starts Wednesday, February 6 at noon Eastern and ends Wednesday, February 13 at noon Eastern!
If you've participated in one of their FreeWeeks before, you know what to expect. If this is your first time, you’re in for quite a treat!
Anyone with a free Club EWI membership gets complete access to Elliott Wave International's Daily Futures Junctures and Monthly Futures Junctures. Senior Analyst Jeffrey Kennedy scours the markets to find the best commodity opportunities and serves them up to you on three different time frames at no cost.
A free Club EWI membership is all you need to get access to FreeWeek. Sign up for FreeWeek now!
Enjoy your complete FreeWeek access to EWI's Commodity Forecasts!
New Poll: Is it Time to Buy Banks
The January survey shows that 43% of the respondents believe that the Tech Sector will be down by over 5% in the first quarter of 2008. So far these folks are right on target, NASDAQ was down over 9.9% in January. The trend in Tech does not appear hopeful looking forward for the next two months.
Banks have recently completed their fourth quarter earnings reports. One immediate question will be if all the bad news is out of the way. The entire sector has been pounded with large write-downs and negative news related to the subprime fallout. There also is an industry consolidation underway, as outlined with the Bank of America acquisition of Countrywide.
Is it time to start bottom feeding and purchase banks? Is this the start of the recovery? Take the new poll !
Friday, February 1, 2008
HingeBull: Five More Outperformers
HingeBull is a selected list of stocks with the potential to outperform the market over the next 12 months. The earlier Five Smallcaps Primed to Soar article outlined five smaller stocks with excellent prospects. Despite the recent volatility in the markets, there are still stocks available with outstanding possibilities. The recent market churn improved the state of affairs by making many of these equities available at a discount.
These stocks were initially found using the HingeFire stock screener to search for stocks with solid balance sheets and price growth over the past year. Further comprehensive assessment revealed strong balance sheets, future growth outlooks, and associated stock price potential for these companies.
Five additional stocks rounds out the HingeBull list for a total of ten stocks. These additional stocks share the attribute that all are larger established companies rather than small caps. The firms are well positioned in industries which are growing; Agriculture, Insurance, and Medical. In many ways, all five of the companies below are under-valued compared to their growth potential over the upcoming twelve months.
- AG (AGCO Corp.)
- AOC (Aon Corp.)
- BG (Bunge Ltd.)
- ISRG (Intuitive Surgical Inc.)
- MOS (Mosaic Co.)
It is not a mistake that three of the five stocks on the list are focused on global agriculture. This reflects the predominant view that world-wide commodities will out-perform over the next 12 months due to increasing demand for crops. AGCO, Bunge, and Mosaic are well positioned to take advantage of this growing market.
Over the upcoming weeks, a number of these stocks will be explored in detail. A brief overview of these five is provided below:
AGCO Corp (AG)
AGCO Corporation manufactures and distributes agricultural equipment and related replacement parts worldwide. The company's products include tractors, combines, self-propelled sprayers, hay tools, forage equipment, and implements, as well as a line of diesel engines. AGCO has benefited from the growth in both the agriculture industry and worldwide markets over the past year; trends that are expected to continue.
With a market cap of 5.73 B, the company has demonstrated solid revenue growth of over 30% per quarter (YoY). The 19.48 forward P/E ratio shows that the stock has solid value aspects, while the 1.36 PEG ratio demonstrates potential upside growth.
Aon Corp. (AOC)
In many ways, Aon Corp is a turn-around story. Three years ago, regulators from New York, Connecticut, and Illinois accused it and of cheating customers. Aon's stock plunged by more than a third, and its finances appeared to be weakening.
Gregory C. Case arrived as a turn-around CEO, and put the company back on track. Operating profit in 2007 is expected to come in at more than $945 million, up 26% from a year earlier, with revenue rising 10%, to $9.8 billion. With a market cap of over 12 billion, Aon is the largest U.S. insurance broker. The company was put together by string of over 400 acquisitions over time, and the current management team has taken steps to streamline operations and reduce overlap.
Bunge Ltd. (BG)
Some analysts view agriculture stocks as simply an ethanol play. However the ethanol market retracted in late 2007, while the market growth for firms still increased – driven by international demand.
Bunge operates in three agriculture segments; Agribusiness, Fertilizer, and Food Products. With a market cap of 15B the company still has room to growth with recent quarterly earnings and revenue growth (YoY) north of 80%. The P/E of 19 is still reasonable for a firm seeing a continuing upward curve in international agriculture sales.
Intuitive Surgical Inc. (ISRG)
Intuitive Surgical provides technology into a growing medical market. The company developed the da Vinci system for assisted, minimally invasive surgery, and has long been a popular story with investors.
ISRG sports lofty valuations with a forward P/E of 57. The company’s growth in both revenue and sales supports these expectations however. The company has no debt and solid margins to support its continuing growth.
Intuitive Surgical announced a 4th quarter earnings on January 31st. The quarterly profit more than doubled to $1.24 per share as compared to 62 cents per share from a year ago. The management team announced expectations for 40% growth in 2008. This drove the stock to open up 22% to $310 this morning.
Mosaic Co. (MOS)
Mosaic Corp is an agriculture play. The company engages in the production and marketing of crop nutrient and animal feed products worldwide. It operates in four segments: Phosphates, Potash, Offshore, and Nitrogen.
Mosaic has a 40 billion market cap and is a giant in the agriculture sector. The company has demonstrated stunning growth over the past year for a large company with expectations that the international market will continue to drive it into the upcoming year. The forward P/E of 15 is quite reasonable from a valuation perspective.
Summary
The companies outlined above represent more established value situations than the initial five small caps on HingeBull list. ISRG, of course, is more in the growth camp than a value candidate. Most fundamental analysts would view the other firms as properly valued rather than deeply valued; however the growth prospects over the next twelve months for these companies appears to be exceptional.
These larger companies round out the HingeBull list by providing an opportunity to diversify the entire portfolio with less speculative candidates; thereby reducing the overall Sharpe ratio and beta while still providing the potential for returns which outperform the market. As always, there are never any sure winners, but solid research can put the market edge in your corner.
Disclosure: The author does not have a position in any of the equities mentioned in this article. The information provided does not constitute a solicitation to buy, or an offer to sell securities.

