Showing posts with label software tools. Show all posts

Saturday, August 2, 2008

How to Screen for Strong Banks

Amidst all the carnage in the financial sector, how can you screen for the stronger banks and financial institutions that are likely go come out of the credit crunch as leaders.

The best starting point is creating a screen that searches for potential candidates. The key question is what criteria should be in this screen. Basically you need to hunt for financial institutions that display the following characteristics.

  • The earnings are still positive.
  • The yield is above 0.5%.
  • The bank stocks trades at reasonable volume above a price of $2
  • The bank stock price performance is exhibiting strength against both the S&P 500 and the bank stock index over the past 3 and 6 month periods.
  • Technical the bank is exhibiting positive moving average trends in the short term and the rate of change is positive.

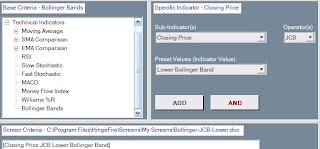
A basic bank screen that meets the points above can be created within HingeScreen. A user can go to create mode and add the following criteria. In this case, we are searching for financial institutions priced above $2 with volumes over 10K that have outperformed the S&P 500 and KBW bank index. The trailing dividend yield must be above 0.5% (forward yield can also be considered). Technically the rate of change (ROC) must be positive, while the recent 20 day moving average must be above the 50 day. These technical points will show a recent positive trend in stock pricing.

The screen is saved as BankScanOne.


The next step is to jump to Execute Mode and run the screen. The results align with expectations; it is a mix of stronger regional banks, REITs (primarily with a healthcare focus), and some financial service organizations.


The stronger banks in the results such Valley National Bancorp NJ (VLY), and Wilshire Bancorp (WIBC) are examples of regional institutions that avoided obscene mortgage lending and maintained their balance sheets in good order over the past few years.

The majority of the REITS that show up in the results such as Health Care Property (HCP), Health Care REIT (HCN), and Healthcare Realty Trust (HR) are examples of REITS that are focused on stronger market segments and have easily avoided the worse aspects of the real estate downturn.


A few financial service organizations such as Northern Trust (NTRS) and PNC Financial Serv. (PNC) also show up in the results. A number of players providing financial services have used the downturn to strengthen their offerings and market position.

Using HingeScreen it is easy to save the results to a spreadsheet for further evaluation. Simply press the button on the right that looks like a floppy disk and the results are saved to a spreadsheet format file that can be opened using Excel. By default the saved result files are placed in the C:\Program Files\HingeFire\Results directory.


HingeScreen is a powerful tool to find stocks that meet the performance and diversification needs for your portfolio. It is useful for identifying candidates that are likely to come out of a downturn as leaders in a sector. HingeFire provides an excellent video library outlining how to use the tool at: http://www.hingefire.com/Education/KnowledgeBase/HingeVideos.aspx

Sunday, July 13, 2008

Hitting Top Returns in midst of Market Turmoil

What does it take to hit solid market returns even when market conditions are leaving the most experienced investors fearful? It comes down to proper stock selection and having the appropriate tools to find the best investments on both the long and short side of the market.

The FREE HingeFire stock screener is a powerful product that merges fundamental and technical indicators in a single tool. This helps put the market edge in the corner of investors.

GregB is now ranked 267 out of 18824 players in the Wall Street Survivor Contest (Traders Wanted - Play $50,000 Stock Trading Game). The evening before the contest, I ran the HingeBuy and HingeSell screens in the HingeScreen 1.5 product. These screens normally produce 30 to 50 results. HingeBuy provides a list of stocks that have the potential to out-perform the market; while HingeSell produces a list of stocks that are likely to under-perform.

It comes down to proper stock selection enabled by the HingeScreen product. I only had to pick a set of stocks once, at the very beginning of the contest to be successful. No need to churn the portfolio or trade.

A summary of the results to date are provided below. Note that all of the longs are still above water despite the violent downtrend in the market over the past few weeks. The balanced long and short portfolio is an excellent example of how to squeeze excess alpha out of the market. The overall return of the portfolio was +14.74% over a few weeks (72.68% on a yearly basis).

Longs
Symbol Return
------------------------
MOS +15.92%
XEC +0.86%
AXYS +0.46%
DAR +10.36%
BMI +0.06%

Shorts
Symbol Return
------------------------
FSNM +53.83%
GSAT +31.12%
CIX +22.65%
LYTS +19.54%
MEDX -5.19%


Disclosure: These stocks have been selected in a fantasy stock selection contest. They are not held in my real portfolio. Investing involves risk. Your results using software screening informational tools may vary. Proper portfolio diversification is important and any outlined investments may not be appropriate for your financial objectives or risk tolerance. This is not a solicitation to buy or sell securities.

Sunday, July 6, 2008

Screening for the Top 2%

How does an investor land up ranked in the top 2%? It takes a serious approach to screening the universe of stocks to sort out the wheat from the chaff. Screening a list of potential candidate stocks is just the first step.

GregB is now ranked 284 out of 17989 players in the Wall Street Survivor Contest (Traders Wanted - Play $50,000 Stock Trading Game). The evening before the contest, I ran the HingeBuy and HingeSell screens in the HingeScreen 1.5 product. These screens normally produce 30 to 50 results. HingeBuy provides a list of stocks that have the potential to out-perform the market; while HingeSell produces a list of stocks that are likely to under-perform.

The next immediate question is how did I narrow these lists down to 5 stocks as longs and 5 stocks as short to use in the Wall Street Survivor contest.

In terms of the five stocks I selected from the HingeBuy list for the contest. I pulled up each stock on the list at the time (there were about 30 to 40) and took a detailed look at the charts, industries, fundamental info, and technical indicators to narrow down the selection. For the HingeSell (short) candidates I basically look for the inverse of the outline below.

Basically the following were evaluated for each potential long stock:

1) Strength of the chart over the past year. Look for a chart where the stock is continually rising with some minor pull-backs. Look for strong increases in the past six months. Do not want a stock where the stock price had a one time big bump due to a news event; nor a stock where the chart is basically flat but still outperformed the associated indexes.

2) Evaluate the industry that the company is in and the industry performance over the last six months compared to other others.

3) Rank the stock within the Industry from a relative performance perspective.

4) Fundamental information evaluation with a focus on earnings growth, revenue growth, cash flow, debt and their associated ratios. Do not focus on forward P/E etc. because many times the projections are nonsense.

5) Technical evaluation of the price chart looking for divergence between the price action and technical indicators (MACD, RSI, etc.). Divergence may indicate an impending change in price action. Also look for extreme readings in oscillator-based indicators which may show that a bounce-back is overdue. Keep in mind that technical indicators are good for evaluating short term action; long term price is driven by fundamentals.

6) Take a look at news from corporate press releases. Look for management churn, re-orgs, layoffs, product cancellations, guidance (vs. price reaction), and regulatory action. These are generally not positive developments.

Basically rank all the stocks on the HingeBuy candidate list from 1 to 5 using the criteria above. Five being the strongest. Select the five stocks with the highest rating.

For HingeSell and shorts - look for the inverse.

Note in my terms, the outline above is my light-weight starting point evaluation. I normally dig into the 10Q / 10K reports when selecting stocks for my actual portfolio. I would urge everyone else to do the same. A stock screener is a tool to find stocks that meet your basic criteria - a more detailed follow-up analysis is needed to find the best stocks for your portfolio that meet your diversification and risk-tolerance needs.

Disclosure: These stocks have been selected in a fantasy stock selection contest. They are not held in my real portfolio. Investing involves risk. Your results using software screening informational tools may vary. Proper portfolio diversification is important and any outlined investments may not be appropriate for your financial objectives or risk tolerance. This is not a solicitation to buy or sell securities.

Sunday, June 29, 2008

Are You in the Top 5% of Investors

GregB is currently ranked 350 out of 15872 investors in the current Wall Street Survivor contest - Traders Wanted - Play $50,000 Stock Trading Game

This is the third time I have selected 5 stocks from the HingeBuy list as longs and 5 stocks from the HingeSell list as shorts the night before a contest opened and held the picks with no trades. The outcome has been the same in all three contests, the results are in the top 5%.

Isn’t time that you used information that could power top-ranked investing results? This is the power of the automated HingeBull and HingeBear selection process that is integrated in the FREE HingeScreen product.

One of the primary beliefs of the founders of HingeFire is that investors do not need $3000 seminars to be successful in the market. Investors simply need the tools to provide an edge in the market and a community of like-minded investors to work with. The objective of HingeFire is to build the tools and community to enable the success of investors at all levels.

I will confess that my results when I try to simply pick stocks that are “hot” or I got a “tip from a friend on" – are dismal. This is why it is important to use tools that can objectively screen the universe of stocks to define the stocks with the most potential. Start using the HingeFire stock screener today and get the information that will give you this type of edge on the market.

Disclosure: These stocks have been selected in a fantasy stock selection contest. They are not held in my real portfolio. Investing involves risk. Your results using software screening informational tools may vary. Proper portfolio diversification is important and any outlined investments may not be appropriate for your financial objectives or risk tolerance. This is not a solicitation to buy or sell securities.

Saturday, June 21, 2008

Wall Street Survivor Update

Is anyone else earning 88.57% returns on a yearly basis?

HingeBuy and HingeSell can help you achieve this type of return.

At the beginning of May, I entered the latest Wall Street Survivor contest. I selected 5 stocks from the HingeBuy list as longs and 5 stocks from the HingeSell list as shorts the night before the contest opened. Wall Street Survivor provides each player with $100,000 in “cash” for investing in the contest. I placed $10,000 into each stock on the first day of the contest and have not made any trades whatsoever since this time.

The longs were:
Symbol Return
------------------------
MOS +24.84%
XEC +11.49%
AXYS +6.16%
DAR +12.72%
BMI -7.92%

The shorts were:
Symbol Return
------------------------
FSNM +33.44%
GSAT +7.25%
CIX +21.57%
LYTS +17.25%
MEDX +1.37%

I did not use leverage (i.e. excess margin) in the contest. The portfolio is currently worth $112,617.93; this is a 12.62% return over a few weeks (or 88.57% on a yearly basis). Player GregB is currently ranked 326 out of 14762 players. Most other players in the contest trade regularly. My result is not bad for simply picking ten stocks, not trading them, and not using leverage.

This demonstrates the power of the HingeBuy and HingeSell automated selection process. Start using the HingeFire stock screener and get the information that will give you this type of edge on the market.

Traders Wanted - Play $50,000 Stock Trading Game

Disclosure: These stocks have been selected in a fantasy stock selection contest. They are not held in my real portfolio. Investing involves risk. Your results using software screening informational tools may vary. Proper portfolio diversification is important and any outlined investments may not be appropriate for your financial objectives or risk tolerance. This is not a solicitation to buy or sell securities.

Friday, June 20, 2008

See the HingeFire Videos

Want to lean how to use HingeScreen to improve your investing? See the excellent videos at the HingeFire website that explain how to use the tool.

The website also contains a wealth of other educational material. Explanations of all the indicators can be found within the Knowledge Base. A full set of documentation for HingeScreen can be found under Support.

HingeFire provides the tools and information that enables investors to improve their understanding of the market. So heat up your investing today, check out the HingeFire resources!

Sunday, June 15, 2008

Does HingeBuy and HingeSell really work?

Yes, you better believe it!

At the beginning of May, I entered the latest Wall Street Survivor contest.

I selected 5 stocks from the HingeBuy list as longs and 5 stocks from the HingeSell list as shorts the night before the contest opened. Wall Street Survivor provides each player with $100,000 in “cash” for investing in the contest. I placed $10,000 into each stock on the first day of the contest and have not made any trades whatsoever since this time.

The longs were:
Symbol Return
------------------------
MOS +24.77%
XEC +11.44%
AXYS +6.47%
DAR +5.11%
BMI -7.16%

The shorts were:
Symbol Return
------------------------
FSNM +25.89%
GSAT +13.29%
CIX +12.48%
LYTS +9.82%
MEDX -2.73%

I did not use leverage (i.e. excess margin) in the contest. The portfolio is currently worth $109,847.18; this is a 9.85% return over a few weeks (or 79.78% on a yearly basis).

Player GregB is currently ranked 373 out of 13850 players. Most other players in the contest trade regularly. My result is not bad for simply picking ten stocks, not trading them, and not using leverage. This shows the power of the HingeBuy and HingeSell automated selection process.

FREE TO PLAY - Fantasy Stock Trading Game

Friday, June 13, 2008

Go to My Broker Feature

One of the additions to the new HingeScreen 1.5 release is a “Go to My Broker” feature. This functionality in the Execute Mode pane allows you to go to your stock broker’s website with the click of a single button. This is a very useful feature at times when you are screening the market for new opportunities.

The image of the gentleman at the top of the screen is the link to your selected default brokerage website.


Under the Options menu at the top, there is a My Broker item. Pulling up this menu shows an Edit Brokers item at the top of the list. The remainder of the list consists of direct website links to major online brokers.
Pressing on the Edit Broker item pulls up a pop up that allows you to add, delete, and edit brokers in the list. Three buttons are at the top, Create New Broker Entry, Save Broker Details, and Delete this Active Broker. A drop down box below this contains a list of brokers, selecting an item displays the broker’s url in the text box below.


The user can select a broker and press the Default button at the bottom to have the broker set as the default (when you press on the image in the Execute Mode pane). Remember to hit the Apply button at the bottom left after all transactions to make them permanent.

The Go to My Broker website feature is a very useful function in the HingeScreen 1.5 release. Users can perform screens and easily pull up their broker’s website to perform trades or get more information.

Thursday, June 12, 2008

How to use Market News at HingeFire

One of the innovative community features offered at the HingeFire website is Market News. Users can submit financial news story links, and allow other members to discuss & comment on the articles.

It is easy to submit a link, simply go to Market News à Submit News at the top after you are logged into the site. A form appears asking you to provide a Title, Summary, url, and category before hitting “publish” at the bottom to post the news.

A direct link to submission is here (need to be logged in).

Market News is a great community feature and I would urge users to try it out!

Wednesday, June 11, 2008

Great News! HingeScreen 1.5 Now Available

The new HingeScreen 1.5 software client includes many features asked for by the user community; more fundamental indicators, additional technical indicators, and new candlestick & chart pattern indicators. The 1.5 software client contains links to many community features at the new website including a Forum, Market News, Broker Ratings, and the Blog.

There is a wealth of educational information at the new HingeFire Site. Some of the best information to see on using the new HingeScreen 1.5 release includes:

Take a Tour
http://www.hingefire.com/Education/TakeaTour.aspx

Videos on usingHingeScreen
http://www.hingefire.com/Education/KnowledgeBase/HingeVideos.aspx

User Documents
http://www.hingefire.com/Support/Documentation.aspx

Information on Indicators
http://www.hingefire.com/Education/KnowledgeBase/Indicators.aspx

One of the primary beliefs of the founders of HingeFire is that investors do not need $3000 seminars to be successful in the market. Investors simply need the tools to provide an edge in the market and a community of like-minded investors to work with. The objective of HingeFire is to build the tools and community to enable the success of investors at all levels.

Monday, May 12, 2008

Screening to Win: The Value Trap

One of the issues with trading the “Value Trap” many traditional fundamental investors fall into. Many investors buy into a stock because it appears cheap, only to watch it decline in value. At the stock drops further it looks cheaper, and the investor attempts to average in and buy even more shares because it now looks even cheaper. “If you liked it at $30 then you are going to love it $20,” goes the old expression.


Many investors screen simply on valuation criteria attempting to find stocks that look “cheap”. If the P/E, P/B, and other factors look good compared to other companies in the same industry then the stock is “on sale”; which is an invitation to hit the “buy” button. Warren Buffet and others talk about value, and many small investors attempt to imitate their “style”. However most of the institutional big boys are normally selling their portfolio about the same time smaller valuation investors are looking to buy in.

The problem with most value driven purchases for individual investors is that 70% of them do not pan out; the bulk of these failures incur significant losses. Most investors do not mine gems in their fundamental searches, instead they are digging up the debris from the discard heap. Many of these stocks are cheap for a reason, the reality is that they are either declining industries, are poorly managed, or are facing business challenges. The stocks hyped in the financial press as value plays are often the worst examples. Despite screening for both forward and backward fundamental ratios; many times the underlying problems are not apparent to value investors.

What are these investors missing?

The primary attribute the investor is forgetting about is price action when screening the universe of stocks. Simply scanning for “cheap” leads to a pile of probable losers. There is normally a reason a stock is a “value play”; in the same way there is a justification of why a used Yugo costs less than a Mercedes.

Investors need to take a firm look at price action as part of their valuation analysis; this means having a compete understanding of charting, technical analysis, and relative strength. In the example above, any basic analysis of moving averages, relative strength of Citi compared to other financial stocks, or evaluation of the chart would have quickly revealed that Citi was doomed during this time period – despite an “appealing valuation” at multiple points.

In order to avoid the 70% of the stocks in the scrap heap, value investors need to screen for more than just fundamental factors as part of their overall evaluation of candidates. The Hingefire stock screener provides a tool that supports evaluation on multiple fundamental and technical criteria which helps put the market edge in the corner of investors.

Tuesday, March 11, 2008

Zecco: Real Time News and Market Data for Active Investors

Now with Zecco Trading - You not only get free trades... you can also get access to real-time news and market data. QuoteStream II tools, available for the low price of $20.00 a month, are especially helpful during times of high volatility, such as those the market has been experiencing lately.

Free Stock Trade. Trade stocks for free on Zecco.com. The Free Trading Community. www.zecco.com

Quotestream II features:


Streaming Portfolios
Create up to 10 portfolios, with 52 symbols per portfolio.


Streaming Options Chains
Near term, leaps, calls or puts, in-the-money or out-of-the-money.


Historical and Intraday Charting
Run comparisons, view a variety of time frames, or plot technical indicators.


News and Headlines
Streaming market and company-specific news from many of the industry leading content providers.


User Configurable Layouts and Screen Displays
Customize many display elements including column fields, background colors, and alerts.


  • Market Movers - View streaming dollar and percent gainers/losers, in addition to most actives.
  • Time and Sales - See what trades are happening, and when.
  • And much more!
QuoteGrid:
If you don't need the entire suite of Quotestream II features, QuoteGrid brings, for just $8.00 a month, state-of-the-art streaming quotes to non-professional traders at Zecco Trading. Now you can trade with the advantage of tick-by-tick, lighting fast, market data.
-
With QuoteGrid, you can:

  • Create up to 10 portfolios or watch lists of up to 52 symbols each.
  • View streaming quotes for indices, stocks, ETFs, options, and more.
  • Select from over 30 customizable field columns.
  • Monitor your P&L tick-by-tick.


Free Stock Trade. Trade stocks for free on Zecco.com. The Free Trading Community. www.zecco.com

Thursday, March 6, 2008

A Preview: HingeScreen 1.5

It's Faster, More Powerful, More User-Friendly and It's Totally Free!!

New Create Mode Screen with many additional features.


Execute Mode that is faster than ever....

Expanded Menus

Instant Access to HingeFire online resources

Over 700 Indicators to choose from

Build and Edit Screens with fewer clicks


Candlestick Indicators, Chart Pattern Indicators...


More Fundamental Indicators. Including Relative Strength against more than 35 indexes. What other tool allows you to compare six month performance against the PHLX Semiconductor Index?

Want to share your screens with others? - Use the Export and Import utilities.


Filter your favorite screens


Easier to Edit, Delete, Save, and Print Screens


Improved Support for Executing Screens - Blazing Fast and Feature Rich


Pick and Choose what information you want to see in your results


Easy Access to Fundamental and Technical Data


Need Results over Time? HingeSort Does It!
This feature is not available in any other product.


Which Symbols are seen more frequently inyour results over time?


Been away on a trip. Need to screen on previous days?
Now get results from previous market periods.

Download older data files whenever needed.
Does any other screener allow you to screen in the past? No!
Only HingeScreen provides this capability.
Need to remember which screens you ran on which days?

Use the Screen History utility to check which screens you ran on which days.

Need Recommendations?


Use the Hinge Quick Buttons to get access to stocks recommended by the community.
HingeScreen 1.5 - Coming in April !

Thursday, January 10, 2008

Will 130-30 Funds take flight?

The interest in 130-30 fund concept continues to grow. Many mutual fund families have added 130-30 funds to their portfolio over the past year.

The “130-30” funds allow managers to short-sell up to 30% of their portfolios, and use the proceeds to buy an extra 30% long. The funds both use leverage and short, attributes which are usually embraced in hedge fund products rather than mutual fund offerings.

Conceptually the fund manager would go long strong stocks while shorting weaker stocks. The expectation is the mutual fund would outperform the market and generate excess alpha for investors. Other possible strategies include merger and instrument arbitrage. One of the concerns raised is how would the industry benchmark the performance of this type of fund.

A recent paper, by Andrew Lo of the Massachusetts Institute of Technology and Pankaj Patel of Credit Suisse, puts forward a proposed 130-30 index. The index uses a number of fundamental and momentum factors to access stocks. Those with the best scores are included in the index as longs and those with the weakest scores as shorts. The research defines a “dynamic bench-mark consisting of a plain-vanilla" 130/30 strategy”.

Note the HingeFire stock screener is excellent tool for identifying stocks utilizing the fundamental and technical criteria used in the type of model outlined in this paper. The model uses fundamental criteria such as P/E, P/S, and P/B as well as technical criteria such as Money Flow, MACD, and RSI. The HingeFire stock screener is one of the few products that offers a full complement of fundamental and technical indicators.

Naturally there are questions whether the type of mechanical approach proposed in the “130/30: The New Long-Only” paper actually represents a valuable index, or is simply another stock picking strategy. This leads to immediate questions about the value of comparing the returns of any particular 130-30 mutual fund against this index. There is an expectation that the market will either accept or reject the dynamic index model over time as the new 130-30 funds become more popular.

Tuesday, January 1, 2008

Happy New Year from HingeFire

I want to wish everyone a happy and healthy 2008!

The "Screening to Win" series about technical indicators has recently been presented in the HingeFire blog. With the recent addition of the Bollinger Band summary the series is complete.

The articles detail how to use technical indicators to enhance your investing. Hopefully these summaries will provide traditional fundamental investors with some solid insight on how to incorporate technical indicators to improve their returns. An index of the articles is provided below:

Screening to Win: Moving Averages

Screening to Win: RSI (Relative Strength Index)

Screening to Win: Fast and Slow Stochastic

Screening to Win: MACD (Moving Average Convergence / Divergence)

Screening to Win: MFI (Money Flow Index)

Screening to Win: Williams %R

Screening to Win: Bollinger Bands

A Few Days left to Win an iPod

For HingeFire screener users, there are just a couple days left to qualify for the iPod before the drawing. A drawing to win an iPod will be held on Janurary 5th for those who complete the user survey. One of the benefits of being a HingeFire user is that you get to drive the future development directions for the product. Please take the survey found at: http://www.hingefire.com/user-survey.html

The survey only takes about 20 minutes and all users who take the survey are added to a drawing for an iPod! We look forward to your feedback!

Friday, December 28, 2007

Screening to Win: Bollinger Bands

The overview below describes one of the common technical indicators – Bollinger Bands and provides insights on how to utilize it in your stock selection. Hopefully this outline will provide traditional fundamental investors with some solid insight on how to incorporate technical indicators into their screening. The free HingeFire Stock Screener which can be found at http://www.hingefire.com is one of the few tools available that includes a wide selection of fundamental and technical criteria for selecting stocks. Using a combination of fundamental and technical screening is a powerful tool for winning in the market.

Bollinger Bands

Bollinger Bands Overview


Bollinger Bands were created by John Bollinger in the early 1980s. The intention of Bollinger Bands is to allow the dynamic comparison of volatility and associated price levels over time.

Bollinger Bands are created by taking a 20 day SMA average and then placing two bands, one above and the other below, at two standard deviations away from the central SMA line. These bands are drawn on the same chart as the stock price.

The lower Bollinger band normally marks a support level while the upper band defines resistance. Many times a dropping or rising price level only crosses outside the bands for a single day. In some sense most stocks are not more volatile than the bands associated with Bollinger, any price outside the band is likely to quickly revert to a level inside. One exception are situations in which the equity price is quickly rising and falling, and the bands “open up” as the volatility increases.

The HingeFire tool provides support to incorporate Bollinger Bands in your creation of screens for stocks. Users can scan to find stocks whose prices are at extreme and unsustainable short-term levels. The HingeFire screener can uncover stocks that are outside the upper and lower Bollinger Bands, as well as those where the price has just crossed these levels in either direction.

How to use Bollinger in screening

Most investors utilize the crossovers above the upper Bollinger Band or below the lower Bollinger Band when screening with the indicator. Bollinger crossovers represent volatility extremes, and usually imply that the price will snap back shortly. Many times these serve as excellent short-term entry points when confirmed with other indicators.

Another common method to screen with Bollinger is to scan for stocks that are outside the upper and lower bands. This will catch stocks that have been in these extremes for more than a single day.

Crossing above the upper Bollinger

The upper Bollinger Band serves as a resistance level. Stocks whose prices rise above this level tend to snap back below it, many times in under a single day. This is especially true in situations where the bands do not “open up” due to increased volatility. If the Bollinger Bands remain steady in width then if is likely that the price increase above the upper band is short lived.

AANB (Abigail Adams National Bancorp Inc.) crossed above the upper Bollinger Band. Note that the bands are not widening, but have remained fairly static in width over time. It is likely that this price rise outside the upper band over the $11.62 level will not last. The normal expectation will be for the closing price to drop below the band shortly. To many investors this would serve as an indicator that they should wait before entering long, and only consider a short-term short position as the current price levels.

Crossing below the lower Bollinger

The lower Bollinger Band acts as a support level. Normally when the price of a stock falls below the lower band, it tends to revert back above it. The cross below is of interest because this event many times lasts only a single day and serves as a good long entry point in some situations.

GWR (Genesee & Wyoming Inc.) dropped below the lower Bollinger Band today when the price closed at $24.78. The width of the bands has not changed greatly over the past couple of months after widening after the drop in November. The current drop started in early December starting near the upper band and now possibly ending after crossing the lower band. Assuming the information cross correlates with other technical and fundamental indicators, this may serve as a good entry point for a long investor.

Price above upper Bollinger

Sometimes the price can rise above the upper Bollinger Band for several days before retreating to inside the band. This usually occurs in scenarios where the band rises and widens with the increase in the stock price and volatility.

EEQ (Enbridge Energy Management LLC) rose outside the upper Bollinger Band for several days in early November. The closing prices remained outside the band for five days as the stock price rose and the Bollinger Band widened. Eventually the stock price peaked and reverted below band. Some investors screen for situations where the stock price is above the upper Bollinger Band, pull up the charts, and then implement short trade entries after the price action peaks out.

Price below lower Bollinger

In some situations, the price of a stock can drop below the lower Bollinger Band for several days. This usually occurs in scenarios where the stock price is in free-fall and the band widens to accommodate the increasing volatility. Normally the price will revert inside the band after a few days when the selling momentum dissipates.

A recent scan using the HingeFire tool found that WYE (Wyeth) dropped below its lower Bollinger Band for the past three days. The band has opened up in the direction of the price drop and widened. As with many situations, the recent drop in Wyeth is a news driven event, the market has concerns about potential generic competition with one of it leading patent-protected drugs. Usually these types of news stories only hold the price down for a short period of time. A patient investor would monitor this situation and wait for an opportunity to put on a long position if they believe the fundamentals of the company are sound.

Bollinger Summary

By themselves, Bollinger Bands do not normally generate pristine buy and sell signals. It is best to cross correlate information from Bollinger with other technical indicators before taking action. On a chart, Bollinger Bands are excellent for identifying periods of high and low volatility, as well as extreme pricing levels.

Many investors utilize Bollinger to look for divergences in stock price and the volatility of the bands. A small number of investors try to set different Bollinger periods and standard deviations on charts to match the particular equity under evaluation. However the traditional 20 day Bollinger with two standard deviation bands is normally the best for intermediate term studies.

The HingeFire tool supports users in screening for the following situations with the Bollinger Band indicator:

  • Crossing above the upper Bollinger.
  • Crossing below the lower Bollinger.
  • Price above the upper Bollinger.
  • Price below the lower Bollinger.

Combining technical indicators such as Bollinger Bands with commonly used fundamental criteria and technical indicators when selecting your investments helps put the market edge in your corner. The Bollinger support in the HingeFire Stock Screener adds a powerful tool that enables the searching for volatility-related extremes which will improve the timing of your market transactions.

Tuesday, December 11, 2007

Screening to Win: Williams %R

The overview below describes one of the common technical indicators – Williams %R and provides insights on how to utilize it in your stock selection. Hopefully this outline will provide traditional fundamental investors with some solid insight on how to incorporate technical indicators into their screening. The free HingeFire Stock Screener which can be found at http://www.hingefire.com is one of the few tools available that includes a wide selection of fundamental and technical criteria for selecting stocks. Using a combination of fundamental and technical screening is a powerful tool for winning in the market.

Williams %R

Williams %R Overview


The Williams %R was created by Larry Williams, and is useful for identifying overbought and oversold conditions in the market. The indicator shows the relationship of the current close in relation to the high-low range over a fourteen day period of time

Values above 80 are considered oversold while values below 20 are considered overbought. Note that this is the exact opposite of most oscillators that utilize a scale of 0 to 100.

The Williams %R Indicator is normally plotted inversely with 100 at the bottom and 0 at the top of the vertical axis. This is reverse of most oscillator graphs. Some charts present the indicator as running from -100 to 0

By the nature of its formation, the Williams %R indicator is generally quite choppy and active. Many times it will provide false signals, which is why investors should look for confirmation from charts or other indicators before entering a transaction.

The HingeFire tool provides support to incorporate Williams %R in your creation of screens for stocks. Users can scan to determine if the Williams indicator is greater than or less than the key 20 (overbought) and 80 (oversold) levels, and also establish if the Williams %R value has just crossed above (JCA) or below (JCB) these thresholds.

How to use Williams %R in screening

Most investors utilize the crossovers from Overbought and Oversold conditions when screening with the Williams %R indicator. Unlike other oscillators, many times crossing into an extreme is of interest rather then just crossing out of it.

Many times the Williams indicator demonstrates price pressure on the edge of an extreme leading to a cycle of higher or lower prices in the direction of the prevailing trend for the period of time. This leads investors to screen for just crossing into extremes below 20 (overbought) or above 80 (oversold); as well as crossing out of these conditions.

Crossing into oversold

Stocks crossing above 80 are considered oversold with Williams %R. Many stocks cross above this threshold and continue in the direction of the prevailing trend for considerable periods of time. Many investors correlate the cross into oversold territory with other technical indicators and use the combination to gauge short-term price momentum.

MFRI (MFRI Inc.) recently crossed again into oversold territory under 80 (plotted at the bottom). The previous cross into oversold territory on October 22nd led to a significant slide in the price of the stock over several weeks. The recent crossover could be setting the table for a similar occurrence.

Crossing into overbought

Stocks crossing below the 20 threshold are considered overbought in the Williams %R indicator. Many times crossing below this level can be a sign that the price increases may continue for a several week period of time; therefore many investors screen for this occurrence.

A fairly volatile stock APFC (American Pacific Corp.) had recently crossed below the 20 level placing it in overbought territory. The earlier cross below this level at the beginning of October demonstrates that this can many times herald the start of a short-term period of price increases while Williams %R remains below the 20 threshold (plotted at the top)

Crossing out of oversold

Many times excellent opportunities exist when the Williams %R indicator crossed below the 80 threshold indicating the stock is not longer oversold. Most traders correlate this change with other technical indicators to confirm the new trend. Some investors wait until the Williams oscillator crosses the 50 mark before acting on a trend reversal. The Williams %R indicator is choppy by nature and can easily reverse after crossing below extremes which is why it is important to wait for the new trend to develop.

A recent HingeFire screen found that DRIV (Digital River Inc) has just crossed below the 80 level exiting the oversold condition. Correlation with other indicators may indicate that the new trend of increasing prices rising is likely to remain in place for several weeks.

Crossing out of overbought

Another trend reversal scenario occurs when the Williams %R indicator crossed above the 20 level indicating the stock is no longer overbought. Correlation with other technical indicators often indicates opportunities where the price is likely to continue to drop in price over a several week period. This can enable investors to time solid entry points at short term troughs in price or look at shorting scenarios.

FUQI (Fuqi International Inc.) held its IPO in November. Since this time the stock has traded in a range of $6 to $11.50. Recently the Williams %R crossed above the 20 threshold exiting the overbought condition. Since this time the price of the stock has dropped by more then two dollars.

Williams Summary

Williams is similar to the stochastic indicator, however the 14 days Williams %R tends to be more choppy. This leads at times to false signals regarding trend reversals and breakouts; on the positive side the Williams indicator tends to be quick and does not lag greatly. This all gets back to a regular theoretical discussion regarding signal quality versus speed. Overall, it is important to use other technical indicators to confirm the action in the Williams %R before performing transactions.

Many investors use a 28 day version of Williams %R in charts for a smoother version with less false alerts.

The HingeFire tool supports users in screening for the following essential situations with the Williams %R Indicator:

  • Crossing into oversold – Williams crossing above 80.
  • Crossing into overbought – Williams crossing below 20.
  • Crossing out of oversold – Williams crossing below 80.
  • Crossing out of overbought – Williams crossing above 20.

Combining indicators such as the Williams %R Index with other technical indicators enables investors to properly time entrance and exit opportunities in the market. The Williams Indicator support in the HingeFire Stock Screener combined with other fundamental and technical criteria provides a powerful tool to uncover prospects that can enhance your portfolio.


Tuesday, December 4, 2007

Screening to Win: MFI (Money Flow Index)

The overview below describes one of the common technical indicators – MFI and provides insights on how to utilize it in your stock selection. Hopefully this outline will provide traditional fundamental investors with some solid insight on how to incorporate technical indicators into their screening. The free HingeFire Stock Screener which can be found at http://www.hingefire.com is one of the few tools available that includes a wide selection of fundamental and technical criteria for selecting stocks. Using a combination of fundamental and technical screening is a powerful tool for winning in the market.

MFI

Money Flow Index Overview

The Money Flow Index is a momentum indicator utilizing volume that provides a sense of the money flowing in to and out of a security. MFI is created using a fourteen day period and compares the flow of money into a stock (positive flow) to the money flowing out of a stock (negative flow). Each day the average of close, low, and high is calculated and compared to the previous day. On days this average price exceeds the previous day is viewed as positive volume, on days below as negative volume. The positive and negative volume totaled over the 14 day period to create the MFI indicator.

Utilizing a scale of 0 to 100, the Money Flow Index is similar to other momentum oscillators. However MFI augments the underlying pricing information with a volume flow component when forming the oscillator.

The HingeFire tool provides support to incorporate the Money Flow Indicator in your creation of screens for stocks. Users can scan to determine if the MFI indicator is greater than or less than the key 20 and 80 levels, and also establish if the MFI value has just crossed above (JCA) or below (JCB) these thresholds.

How to use MFI in screening

Many investors utilize the Money Flow Index to identify oversold and overbought conditions. MFI levels below 20 are generally considered oversold and those above 80 are considered overbought. However MFI can remain at these levels for lengthy periods of time.

MFI provides solid insight into medium term trends. Investors normally use the Money Flow Index to time transactions or to filter stocks to exclude.

Overbought Territory

Stocks with MFI levels above 80 are considered over bought. Note that a number of these stocks may continue to rise in price and exhibit high MFI readings for a period of time. Most of these stocks are due for a tumble however as they approach an exhaustion level of available purchasers in the market. A number of traders screen for high MFI levels and then continually review the charts over a period of days for possible short candidates.

The MFI for MXM (MAXXAM Inc.) crossed above 80 about 3 weeks ago and has remained at this level. A screen with the HingeFire tool found this as one of the many stocks with an MFI level greater then 80. Pulling up a recent chart for MXM demonstrates that the MFI is likely losing strength and will shortly cross below 80 shortly.

Oversold Territory

Stocks with an MFI below 20 are considered to be oversold. Some oversold stocks are due for a bounce back. Others have negative fundamental and trend information associated with them and may continue to dive in price with solid volume for extended periods of time.. A number of investors screen for stocks with low MFI levels and then sort through the results looking for value candidates at appealing prices. This is a form of searching for recently created value in the market, taking advantage of short term mis-pricing. At times a sector or individual stock is punished by the market pushing it down with volume to levels of attractive valuation. The MFI technical indicator can be used to screen for these situations.

BVF (Biovail Corp.) recently endured a down trend with high volume and is below the 20 MFI level. An investor can research (or screen) the fundamental attributes of this stock such as P/E and see if it appears to be a solid value play now that the price has dropped to lower levels.

Break below Overbought

One common use for MFI is to screen for stocks that have just crossed below (JCB) the overbought condition at the 80 level. This normally serves as notice that the stock may continue to fall in price over the upcoming few weeks. Normally when MFI crosses below this level, the buyers have stepped away from the stock and upside volume is no longer present.

The MFI for MIDD (Middleby Corp.) just crossed below the 80 level. This is one of the examples found in a recent screen using HingeFire for stocks that JCB (just crossed below) the 80 level for MFI. This is normally a sign that buying may be exhausted and the price will retreat for a period of time.

Break above Oversold

One of the most common uses for MFI is to scan for stocks that just broke above the oversold condition and now should continue to rise in price. A breakout above 20 indicates a solid change in momentum for a stock as it exits an oversold condition as the downside volume is reduced.

RRD (RR Donnelley & Sons Co.) recently experienced a spree of selling with an associated drop in price over the past several weeks. The MFI just crossed above the 20 level which is a strong indicator that the selling volume is reduced and the stock has potential upside.

MFI Summary

Money Flow Index bears some similarities to RSI. However the Money Flow index utilizes volume in the calculation, providing an enhanced awareness of the size of fear and greed in the market.

A number of investors look at Money Flow Index on charts to scrutinize for divergences between MFI and the price trend of the stock. However the most common utilization of MFI is screening for oversold and overbought levels as outlined above.

Many investors focused on volume-driven technicals use the HingeFire tool to screen for the following situations with the Money Flow Index:

  • Overbought Territory – Screening for stocks with RSI levels above 80.
  • Oversold Territory – Screening for stocks with RSI levels below 20.
  • Break Below Overbought – Screening for stocks that JCB the 80 level.
  • Break Above Oversold – Screening for stocks that JCA the 20 level.

Combining technical indicators such as Money Flow Index with commonly used fundamental criteria when selecting your investments helps put the market edge in your corner. The MFI support in the HingeFire Stock Screener adds a powerful tool for searching for volume-related extremes that will improve the timing of your market transactions.