Showing posts with label stock screening. Show all posts

Saturday, August 2, 2008

How to Screen for Strong Banks

Amidst all the carnage in the financial sector, how can you screen for the stronger banks and financial institutions that are likely go come out of the credit crunch as leaders.

The best starting point is creating a screen that searches for potential candidates. The key question is what criteria should be in this screen. Basically you need to hunt for financial institutions that display the following characteristics.

  • The earnings are still positive.
  • The yield is above 0.5%.
  • The bank stocks trades at reasonable volume above a price of $2
  • The bank stock price performance is exhibiting strength against both the S&P 500 and the bank stock index over the past 3 and 6 month periods.
  • Technical the bank is exhibiting positive moving average trends in the short term and the rate of change is positive.

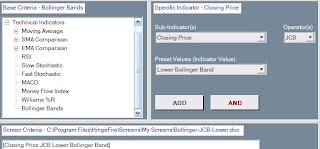
A basic bank screen that meets the points above can be created within HingeScreen. A user can go to create mode and add the following criteria. In this case, we are searching for financial institutions priced above $2 with volumes over 10K that have outperformed the S&P 500 and KBW bank index. The trailing dividend yield must be above 0.5% (forward yield can also be considered). Technically the rate of change (ROC) must be positive, while the recent 20 day moving average must be above the 50 day. These technical points will show a recent positive trend in stock pricing.

The screen is saved as BankScanOne.


The next step is to jump to Execute Mode and run the screen. The results align with expectations; it is a mix of stronger regional banks, REITs (primarily with a healthcare focus), and some financial service organizations.


The stronger banks in the results such Valley National Bancorp NJ (VLY), and Wilshire Bancorp (WIBC) are examples of regional institutions that avoided obscene mortgage lending and maintained their balance sheets in good order over the past few years.

The majority of the REITS that show up in the results such as Health Care Property (HCP), Health Care REIT (HCN), and Healthcare Realty Trust (HR) are examples of REITS that are focused on stronger market segments and have easily avoided the worse aspects of the real estate downturn.


A few financial service organizations such as Northern Trust (NTRS) and PNC Financial Serv. (PNC) also show up in the results. A number of players providing financial services have used the downturn to strengthen their offerings and market position.

Using HingeScreen it is easy to save the results to a spreadsheet for further evaluation. Simply press the button on the right that looks like a floppy disk and the results are saved to a spreadsheet format file that can be opened using Excel. By default the saved result files are placed in the C:\Program Files\HingeFire\Results directory.


HingeScreen is a powerful tool to find stocks that meet the performance and diversification needs for your portfolio. It is useful for identifying candidates that are likely to come out of a downturn as leaders in a sector. HingeFire provides an excellent video library outlining how to use the tool at: http://www.hingefire.com/Education/KnowledgeBase/HingeVideos.aspx

Sunday, July 13, 2008

Hitting Top Returns in midst of Market Turmoil

What does it take to hit solid market returns even when market conditions are leaving the most experienced investors fearful? It comes down to proper stock selection and having the appropriate tools to find the best investments on both the long and short side of the market.

The FREE HingeFire stock screener is a powerful product that merges fundamental and technical indicators in a single tool. This helps put the market edge in the corner of investors.

GregB is now ranked 267 out of 18824 players in the Wall Street Survivor Contest (Traders Wanted - Play $50,000 Stock Trading Game). The evening before the contest, I ran the HingeBuy and HingeSell screens in the HingeScreen 1.5 product. These screens normally produce 30 to 50 results. HingeBuy provides a list of stocks that have the potential to out-perform the market; while HingeSell produces a list of stocks that are likely to under-perform.

It comes down to proper stock selection enabled by the HingeScreen product. I only had to pick a set of stocks once, at the very beginning of the contest to be successful. No need to churn the portfolio or trade.

A summary of the results to date are provided below. Note that all of the longs are still above water despite the violent downtrend in the market over the past few weeks. The balanced long and short portfolio is an excellent example of how to squeeze excess alpha out of the market. The overall return of the portfolio was +14.74% over a few weeks (72.68% on a yearly basis).

Longs
Symbol Return
------------------------
MOS +15.92%
XEC +0.86%
AXYS +0.46%
DAR +10.36%
BMI +0.06%

Shorts
Symbol Return
------------------------
FSNM +53.83%
GSAT +31.12%
CIX +22.65%
LYTS +19.54%
MEDX -5.19%


Disclosure: These stocks have been selected in a fantasy stock selection contest. They are not held in my real portfolio. Investing involves risk. Your results using software screening informational tools may vary. Proper portfolio diversification is important and any outlined investments may not be appropriate for your financial objectives or risk tolerance. This is not a solicitation to buy or sell securities.

Sunday, June 29, 2008

Are You in the Top 5% of Investors

GregB is currently ranked 350 out of 15872 investors in the current Wall Street Survivor contest - Traders Wanted - Play $50,000 Stock Trading Game

This is the third time I have selected 5 stocks from the HingeBuy list as longs and 5 stocks from the HingeSell list as shorts the night before a contest opened and held the picks with no trades. The outcome has been the same in all three contests, the results are in the top 5%.

Isn’t time that you used information that could power top-ranked investing results? This is the power of the automated HingeBull and HingeBear selection process that is integrated in the FREE HingeScreen product.

One of the primary beliefs of the founders of HingeFire is that investors do not need $3000 seminars to be successful in the market. Investors simply need the tools to provide an edge in the market and a community of like-minded investors to work with. The objective of HingeFire is to build the tools and community to enable the success of investors at all levels.

I will confess that my results when I try to simply pick stocks that are “hot” or I got a “tip from a friend on" – are dismal. This is why it is important to use tools that can objectively screen the universe of stocks to define the stocks with the most potential. Start using the HingeFire stock screener today and get the information that will give you this type of edge on the market.

Disclosure: These stocks have been selected in a fantasy stock selection contest. They are not held in my real portfolio. Investing involves risk. Your results using software screening informational tools may vary. Proper portfolio diversification is important and any outlined investments may not be appropriate for your financial objectives or risk tolerance. This is not a solicitation to buy or sell securities.

Saturday, June 21, 2008

Wall Street Survivor Update

Is anyone else earning 88.57% returns on a yearly basis?

HingeBuy and HingeSell can help you achieve this type of return.

At the beginning of May, I entered the latest Wall Street Survivor contest. I selected 5 stocks from the HingeBuy list as longs and 5 stocks from the HingeSell list as shorts the night before the contest opened. Wall Street Survivor provides each player with $100,000 in “cash” for investing in the contest. I placed $10,000 into each stock on the first day of the contest and have not made any trades whatsoever since this time.

The longs were:
Symbol Return
------------------------
MOS +24.84%
XEC +11.49%
AXYS +6.16%
DAR +12.72%
BMI -7.92%

The shorts were:
Symbol Return
------------------------
FSNM +33.44%
GSAT +7.25%
CIX +21.57%
LYTS +17.25%
MEDX +1.37%

I did not use leverage (i.e. excess margin) in the contest. The portfolio is currently worth $112,617.93; this is a 12.62% return over a few weeks (or 88.57% on a yearly basis). Player GregB is currently ranked 326 out of 14762 players. Most other players in the contest trade regularly. My result is not bad for simply picking ten stocks, not trading them, and not using leverage.

This demonstrates the power of the HingeBuy and HingeSell automated selection process. Start using the HingeFire stock screener and get the information that will give you this type of edge on the market.

Traders Wanted - Play $50,000 Stock Trading Game

Disclosure: These stocks have been selected in a fantasy stock selection contest. They are not held in my real portfolio. Investing involves risk. Your results using software screening informational tools may vary. Proper portfolio diversification is important and any outlined investments may not be appropriate for your financial objectives or risk tolerance. This is not a solicitation to buy or sell securities.

Friday, June 20, 2008

See the HingeFire Videos

Want to lean how to use HingeScreen to improve your investing? See the excellent videos at the HingeFire website that explain how to use the tool.

The website also contains a wealth of other educational material. Explanations of all the indicators can be found within the Knowledge Base. A full set of documentation for HingeScreen can be found under Support.

HingeFire provides the tools and information that enables investors to improve their understanding of the market. So heat up your investing today, check out the HingeFire resources!

Sunday, June 15, 2008

Does HingeBuy and HingeSell really work?

Yes, you better believe it!

At the beginning of May, I entered the latest Wall Street Survivor contest.

I selected 5 stocks from the HingeBuy list as longs and 5 stocks from the HingeSell list as shorts the night before the contest opened. Wall Street Survivor provides each player with $100,000 in “cash” for investing in the contest. I placed $10,000 into each stock on the first day of the contest and have not made any trades whatsoever since this time.

The longs were:
Symbol Return
------------------------
MOS +24.77%
XEC +11.44%
AXYS +6.47%
DAR +5.11%
BMI -7.16%

The shorts were:
Symbol Return
------------------------
FSNM +25.89%
GSAT +13.29%
CIX +12.48%
LYTS +9.82%
MEDX -2.73%

I did not use leverage (i.e. excess margin) in the contest. The portfolio is currently worth $109,847.18; this is a 9.85% return over a few weeks (or 79.78% on a yearly basis).

Player GregB is currently ranked 373 out of 13850 players. Most other players in the contest trade regularly. My result is not bad for simply picking ten stocks, not trading them, and not using leverage. This shows the power of the HingeBuy and HingeSell automated selection process.

FREE TO PLAY - Fantasy Stock Trading Game

Friday, June 13, 2008

Go to My Broker Feature

One of the additions to the new HingeScreen 1.5 release is a “Go to My Broker” feature. This functionality in the Execute Mode pane allows you to go to your stock broker’s website with the click of a single button. This is a very useful feature at times when you are screening the market for new opportunities.

The image of the gentleman at the top of the screen is the link to your selected default brokerage website.


Under the Options menu at the top, there is a My Broker item. Pulling up this menu shows an Edit Brokers item at the top of the list. The remainder of the list consists of direct website links to major online brokers.
Pressing on the Edit Broker item pulls up a pop up that allows you to add, delete, and edit brokers in the list. Three buttons are at the top, Create New Broker Entry, Save Broker Details, and Delete this Active Broker. A drop down box below this contains a list of brokers, selecting an item displays the broker’s url in the text box below.


The user can select a broker and press the Default button at the bottom to have the broker set as the default (when you press on the image in the Execute Mode pane). Remember to hit the Apply button at the bottom left after all transactions to make them permanent.

The Go to My Broker website feature is a very useful function in the HingeScreen 1.5 release. Users can perform screens and easily pull up their broker’s website to perform trades or get more information.

Wednesday, June 11, 2008

Great News! HingeScreen 1.5 Now Available

The new HingeScreen 1.5 software client includes many features asked for by the user community; more fundamental indicators, additional technical indicators, and new candlestick & chart pattern indicators. The 1.5 software client contains links to many community features at the new website including a Forum, Market News, Broker Ratings, and the Blog.

There is a wealth of educational information at the new HingeFire Site. Some of the best information to see on using the new HingeScreen 1.5 release includes:

Take a Tour
http://www.hingefire.com/Education/TakeaTour.aspx

Videos on usingHingeScreen
http://www.hingefire.com/Education/KnowledgeBase/HingeVideos.aspx

User Documents
http://www.hingefire.com/Support/Documentation.aspx

Information on Indicators
http://www.hingefire.com/Education/KnowledgeBase/Indicators.aspx

One of the primary beliefs of the founders of HingeFire is that investors do not need $3000 seminars to be successful in the market. Investors simply need the tools to provide an edge in the market and a community of like-minded investors to work with. The objective of HingeFire is to build the tools and community to enable the success of investors at all levels.

Tuesday, June 10, 2008

Coming Wednesday: HingeScreen Release 1.5

Great News! HingeScreen 1.5 has arrived.

The new software release 1.5, and the totally updated website will become available during the day on Wednesday June 11th.

This does have a couple of important ramifications for the user community.

1) Users will have to download the new HingeScreen 1.5 software client at the new site in order to keep using the tool. The earlier 1.2 client is no longer supported. All of your existing screens, and results will automatically transfer on your PC when you upgrade to the same directory, so you will not lose any information.

2) All users' passwords have been reset to your username plus 123. For example an account with the username "paul" will have a default password of "paul123". Users will be able to immediately change their default passwords at their profiles on the new site.

The new HingeScreen 1.5 software client is still FREE, and includes many features asked for by the user community: more fundamental indicators, additional technical indicators, and new candlestick & chart pattern indicators. The 1.5 software client contains links to many community features at the new website including a forum, market news, broker ratings, and the blog. For a full list of the exciting new features in release 1.5, please see the Products section in the new website. A wealth of educational material and training videos are also provided on the new website.

I would like to thank the beta testers who gave feedback over the past couple of months. Our team is working to have a smooth transition tomorrow, and get the full-featured website and software release available to the entire community.

Wednesday, May 14, 2008

What Stocks could potentially rise 100% in price?

Once in a while an article about picking stocks floats by that contains enough practical information to be useful – despite the rare occurrence of this type of event. Today’s news stream brought forward an article by BusinessWeek - Stocks: The Double-Your-Money Club

The article does touch on several truths which HingeFire has outlined in the past including:

  • The best opportunities are in small cap stocks for explosive growth. Purchasing mega-cap stocks will not enable your portfolio to quickly grow.
  • Simply shifting through stocks looking for “cheap” is like “catching a falling knife”. It is important to use technical analysis in conjunction with fundamental valuation to find winning candidates.
  • Looking for strong future revenue and earnings growth compared to current valuation is helpful. However relying on this form of bargain hunting can lead to failure when the expectations don’t play out, which is a very common scenario.

Monday, May 12, 2008

Screening to Win: The Value Trap

One of the issues with trading the “Value Trap” many traditional fundamental investors fall into. Many investors buy into a stock because it appears cheap, only to watch it decline in value. At the stock drops further it looks cheaper, and the investor attempts to average in and buy even more shares because it now looks even cheaper. “If you liked it at $30 then you are going to love it $20,” goes the old expression.


Many investors screen simply on valuation criteria attempting to find stocks that look “cheap”. If the P/E, P/B, and other factors look good compared to other companies in the same industry then the stock is “on sale”; which is an invitation to hit the “buy” button. Warren Buffet and others talk about value, and many small investors attempt to imitate their “style”. However most of the institutional big boys are normally selling their portfolio about the same time smaller valuation investors are looking to buy in.

The problem with most value driven purchases for individual investors is that 70% of them do not pan out; the bulk of these failures incur significant losses. Most investors do not mine gems in their fundamental searches, instead they are digging up the debris from the discard heap. Many of these stocks are cheap for a reason, the reality is that they are either declining industries, are poorly managed, or are facing business challenges. The stocks hyped in the financial press as value plays are often the worst examples. Despite screening for both forward and backward fundamental ratios; many times the underlying problems are not apparent to value investors.

What are these investors missing?

The primary attribute the investor is forgetting about is price action when screening the universe of stocks. Simply scanning for “cheap” leads to a pile of probable losers. There is normally a reason a stock is a “value play”; in the same way there is a justification of why a used Yugo costs less than a Mercedes.

Investors need to take a firm look at price action as part of their valuation analysis; this means having a compete understanding of charting, technical analysis, and relative strength. In the example above, any basic analysis of moving averages, relative strength of Citi compared to other financial stocks, or evaluation of the chart would have quickly revealed that Citi was doomed during this time period – despite an “appealing valuation” at multiple points.

In order to avoid the 70% of the stocks in the scrap heap, value investors need to screen for more than just fundamental factors as part of their overall evaluation of candidates. The Hingefire stock screener provides a tool that supports evaluation on multiple fundamental and technical criteria which helps put the market edge in the corner of investors.

Thursday, March 6, 2008

A Preview: HingeScreen 1.5

It's Faster, More Powerful, More User-Friendly and It's Totally Free!!

New Create Mode Screen with many additional features.


Execute Mode that is faster than ever....

Expanded Menus

Instant Access to HingeFire online resources

Over 700 Indicators to choose from

Build and Edit Screens with fewer clicks


Candlestick Indicators, Chart Pattern Indicators...


More Fundamental Indicators. Including Relative Strength against more than 35 indexes. What other tool allows you to compare six month performance against the PHLX Semiconductor Index?

Want to share your screens with others? - Use the Export and Import utilities.


Filter your favorite screens


Easier to Edit, Delete, Save, and Print Screens


Improved Support for Executing Screens - Blazing Fast and Feature Rich


Pick and Choose what information you want to see in your results


Easy Access to Fundamental and Technical Data


Need Results over Time? HingeSort Does It!
This feature is not available in any other product.


Which Symbols are seen more frequently inyour results over time?


Been away on a trip. Need to screen on previous days?
Now get results from previous market periods.

Download older data files whenever needed.
Does any other screener allow you to screen in the past? No!
Only HingeScreen provides this capability.
Need to remember which screens you ran on which days?

Use the Screen History utility to check which screens you ran on which days.

Need Recommendations?


Use the Hinge Quick Buttons to get access to stocks recommended by the community.
HingeScreen 1.5 - Coming in April !

Thursday, February 7, 2008

HingeBear: Ten Underperforming Stocks

HingeBear is a selected list of ten stocks with the likelihood to underperform the market over the next 12 months.

A couple of earlier articles outlined stocks with a bullish case (Five Smallcaps Primed to Soar / HingeBull: Five more outperformers). This summary focuses on the opposite angle, stocks that investors should spurn from a long position perspective. While some of these stocks are in industries such as homebuilders that have rallied off of 52 week lows in the past few weeks, these particular stocks are likely to underperform their peers over the next 12 months. If you want exposure to these sectors then there are probably better upside candidates available.

These stocks were initially found using the HingeFire stock screener to search for stocks with struggling fundamentals and price declines over the past year. Further comprehensive assessment revealed poor balance sheets and declining growth outlooks, factors which will probably lead to underperformance over the upcoming year.

A number of these stocks appear to have limited downside left and may not be appropriate short candidates. A few of them have the potential for the second shoe to drop leading to further price declines.

The following stocks are included in the initial HingeBear list:

  • ALTU (Altus Pharmaceuticals Inc.)
  • AMGN (Amgen Inc.)
  • C (Citigroup Inc.)
  • HOV (Hovnanian Enterprises Inc.)
  • LNY (Landry's Restaurants Inc.)
  • MRVL (Marvell Technology Group Ltd.)
  • MBI (MBIA Inc.)
  • SLM (SLM Corp.)
  • WM (Washington Mutual Inc.)
  • RT (Ruby Tuesday Inc.)

Further brief commentary about each is provided below:

Altus Pharmaceuticals Inc. (ALTU)

Altus Pharmaceuticals, Inc., a biopharmaceutical company, engages in the development and commercialization of oral and injectable protein therapeutics for gastrointestinal and metabolic disorders.

Altus has roughly $150 million in net cash, yet it burned through $45 million in capital over the trailing 12 months. In December, the company lost a partnership agreement with Genentech for its hormone replacement therapy, ALTU-238.

While the company has rebounded from its low near $5 so far this year, the future outlook is not all that bright. There are better alternatives in the Bio industry for consideration as an investment.

Amgen Inc. (AMGN)

While AMGN beat the 4th quarter profit estimates, it had flat earnings and lower sales. The sales of many drugs are dropping off rapidly for the biotechnology giant. There is nothing in the upcoming forecast which demonstrates that Amgen will match either the market or sector performance.

Citigroup Inc. ( C )

CDOs anybody? This banking giant is in trouble for its inability to control risk. It is now in the position of wandering hat in hand to international sovereign funds looking for a bailout to meet capital ratios.

There is the possibility that the banking sector has bottomed out after the fourth quarter earning reports. However Citi is unlikely to perform better than the other banks during a sector recovery.

Hovnanian Enterprises Inc. (HOV)

With the housing sector in free-fall, nothing looks good in homebuilders. Hovnanian is one of the homebuilders with the weakest balance sheets and numerous impairments. Even if the sector recovers, Hovnanian is not expected to keep up in price appreciation. In fact from the straight-forward math, the company may face liquidity problems over the coming year unless sales increase – a scenario which is not likely in 2008.

Landry's Restaurants Inc. (LNY)

Decreasing sales, poor ratios, and financials that Moody’s downgraded to a “negative’ outlook on debt ratings in December. There is no information for this restaurant operator that can be described as promising. One recent twist is that Landry's boss, Tilman Fertitta, has recently proposed buying the remaining 61 percent stake in the business to make it a private business; it is not known if this proposal will pan out.

Marvell Technology Group Ltd. (MRVL)

Executive suite turmoil, losses, and no uplifting news. There appears to be no angle for this mid-cap chip maker that would provide any indication that it will match the overall performance of the market.

MBIA Inc. (MBI)

MBIA is a troubled bond insurer with a large SIV insurance exposure in the subprime mess. William Ackman of Pershing Square Capital Management recently outlined to regulators that MBIA still has an additional $12B of CDO exposure that has not been properly disclosed. The firm is desperately hoping that either regulators or an acquisition will bail it out. If one of these scenarios does not play out then it will liable be priced in the pennies like fellow insurer ACA Capital. If some sort of plan is arrived at then the stock price may increase from current levels.

SLM Corp. (SLM)

Sallie Mae can use an education on how to produce profits and run a fiscally responsible operation. This education financer has a long list of problems in the press over the past year and the situation is not expected to improve moving into 2008.

Washington Mutual Inc. (WM)

Washington Mutual is a large bank with a long list of troubles. It’s cousin Countrywide was recently purchased by BoA for pennies on the dollar. JPM Chase is currently mulling the acquisition of WaMu according to most press reports. If the bank does not get acquired then it is apt to sink further. On the other side of the coin any announcement about being acquired will likely elevate the stock.

Ruby Tuesday Inc. (RT)

Ruby Tuesdays recently cut its 2008 earnings outlook. This is on top of a second quarter earnings report (2008) showing same-restaurant sales decreased 10.8% and 8.7% at company-owned and domestic franchise restaurants. The statistics demonstrate falling revenue and earnings. Sometimes there is a reason that a trailing P/E of 7 does not represent value. There is nothing in the Ruby Tuesday’s information which would recommend it as an investment which will match market performance.


Disclaimer: The summaries provided at the HingeFire blog should not be construed as official investment advice.. You should see a qualified investment advisor if you need direct advice about your individual financial situation. The information provided does not constitute a solicitation to buy, or an offer to sell securities. The author does not hold a position in any of the securities outlined above.

Friday, February 1, 2008

HingeBull: Five More Outperformers

HingeBull is a selected list of stocks with the potential to outperform the market over the next 12 months. The earlier Five Smallcaps Primed to Soar article outlined five smaller stocks with excellent prospects. Despite the recent volatility in the markets, there are still stocks available with outstanding possibilities. The recent market churn improved the state of affairs by making many of these equities available at a discount.

These stocks were initially found using the HingeFire stock screener to search for stocks with solid balance sheets and price growth over the past year. Further comprehensive assessment revealed strong balance sheets, future growth outlooks, and associated stock price potential for these companies.

Five additional stocks rounds out the HingeBull list for a total of ten stocks. These additional stocks share the attribute that all are larger established companies rather than small caps. The firms are well positioned in industries which are growing; Agriculture, Insurance, and Medical. In many ways, all five of the companies below are under-valued compared to their growth potential over the upcoming twelve months.

  • AG (AGCO Corp.)
  • AOC (Aon Corp.)
  • BG (Bunge Ltd.)
  • ISRG (Intuitive Surgical Inc.)
  • MOS (Mosaic Co.)

It is not a mistake that three of the five stocks on the list are focused on global agriculture. This reflects the predominant view that world-wide commodities will out-perform over the next 12 months due to increasing demand for crops. AGCO, Bunge, and Mosaic are well positioned to take advantage of this growing market.

Over the upcoming weeks, a number of these stocks will be explored in detail. A brief overview of these five is provided below:

AGCO Corp (AG)

AGCO Corporation manufactures and distributes agricultural equipment and related replacement parts worldwide. The company's products include tractors, combines, self-propelled sprayers, hay tools, forage equipment, and implements, as well as a line of diesel engines. AGCO has benefited from the growth in both the agriculture industry and worldwide markets over the past year; trends that are expected to continue.

With a market cap of 5.73 B, the company has demonstrated solid revenue growth of over 30% per quarter (YoY). The 19.48 forward P/E ratio shows that the stock has solid value aspects, while the 1.36 PEG ratio demonstrates potential upside growth.

Aon Corp. (AOC)

In many ways, Aon Corp is a turn-around story. Three years ago, regulators from New York, Connecticut, and Illinois accused it and of cheating customers. Aon's stock plunged by more than a third, and its finances appeared to be weakening.

Gregory C. Case arrived as a turn-around CEO, and put the company back on track. Operating profit in 2007 is expected to come in at more than $945 million, up 26% from a year earlier, with revenue rising 10%, to $9.8 billion. With a market cap of over 12 billion, Aon is the largest U.S. insurance broker. The company was put together by string of over 400 acquisitions over time, and the current management team has taken steps to streamline operations and reduce overlap.

Bunge Ltd. (BG)

Some analysts view agriculture stocks as simply an ethanol play. However the ethanol market retracted in late 2007, while the market growth for firms still increased – driven by international demand.

Bunge operates in three agriculture segments; Agribusiness, Fertilizer, and Food Products. With a market cap of 15B the company still has room to growth with recent quarterly earnings and revenue growth (YoY) north of 80%. The P/E of 19 is still reasonable for a firm seeing a continuing upward curve in international agriculture sales.

Intuitive Surgical Inc. (ISRG)

Intuitive Surgical provides technology into a growing medical market. The company developed the da Vinci system for assisted, minimally invasive surgery, and has long been a popular story with investors.

ISRG sports lofty valuations with a forward P/E of 57. The company’s growth in both revenue and sales supports these expectations however. The company has no debt and solid margins to support its continuing growth.

Intuitive Surgical announced a 4th quarter earnings on January 31st. The quarterly profit more than doubled to $1.24 per share as compared to 62 cents per share from a year ago. The management team announced expectations for 40% growth in 2008. This drove the stock to open up 22% to $310 this morning.

Mosaic Co. (MOS)

Mosaic Corp is an agriculture play. The company engages in the production and marketing of crop nutrient and animal feed products worldwide. It operates in four segments: Phosphates, Potash, Offshore, and Nitrogen.

Mosaic has a 40 billion market cap and is a giant in the agriculture sector. The company has demonstrated stunning growth over the past year for a large company with expectations that the international market will continue to drive it into the upcoming year. The forward P/E of 15 is quite reasonable from a valuation perspective.

Summary

The companies outlined above represent more established value situations than the initial five small caps on HingeBull list. ISRG, of course, is more in the growth camp than a value candidate. Most fundamental analysts would view the other firms as properly valued rather than deeply valued; however the growth prospects over the next twelve months for these companies appears to be exceptional.

These larger companies round out the HingeBull list by providing an opportunity to diversify the entire portfolio with less speculative candidates; thereby reducing the overall Sharpe ratio and beta while still providing the potential for returns which outperform the market. As always, there are never any sure winners, but solid research can put the market edge in your corner.

Disclosure: The author does not have a position in any of the equities mentioned in this article. The information provided does not constitute a solicitation to buy, or an offer to sell securities.

Thursday, January 17, 2008

HingeBull: Five Small Caps Primed to Soar

Most investors continually search for the next “ten-bagger” which will explode with enormous returns. Many of these opportunities are found in small company stocks. Typically small caps as a group outperform larger companies. However significant risks must be navigated when selecting individual small cap stocks.

A dearth of analyst coverage means that small-cap stocks are more likely to be priced inefficiently. The majority of the growth and stock price acceleration occurs when companies are still small. Most institutional investors avoid small caps, at least until they grow larger; this leaves many small caps as yet undiscovered champions.

While the market has taken a dive in recent weeks, there are still a number of small cap stocks that appear to offer excellent growth potential. The recent market turmoil has the advantage of now offering these stocks at a discount from previous prices.

Several growth oriented small caps show outstanding potential for future returns. In the hardware, software and service sectors, five promising candidates include; Concur Technologies (CNQR), HMS Holdings (HMSY), Sigma Designs (SIGM), Synchronoss Technologies (SNCR), and Synaptics (SYNA).

These stocks were initially found in using the HingeFire stock screener to search for growth-oriented stocks capitalized between 500M to 2B. Further comprehensive assessment revealed strong balance sheets, growth outlooks, and stock price potential for these companies. Importantly, the firms also have the attractive attribute of being engaged in rapidly growing market segments.

Concur Technologies (CNQR)

Most companies are going to great lengths to reduce employee travel and business expenses. In many cases, the reporting of this non-core activity is being outsourced to outside firms or companies utilize third party software packages to track this information. Concur Technologies is a leading provider of employee spending management solutions.

The business of outsourced travel and entertainment accounting is expected to grow to $7 billion over the next five years. Concur Technologies is positioned directly in the middle of this growth segment.

Concur Technologies recently acquired its primary competitor, Gelco, through the acquisition of H-G Holdings in a $160 million cash deal in October. The firm has a 1.3 billion market cap with a 2008 sales estimate of $200 million. The company has minimal debt and strong operating cash flow.

Even at $30, Concur is not cheaply priced. The company sports a trailing P/E of nearly 150 and a forward P/E of 50. CNQR will have to execute perfectly to hit expectations of growth and earnings to maintain these rich valuations. However there is a strong belief in the analyst community that the company will hit the expectations of 55% growth expectations for revenue and income.

Concur Technologies shows the attributes of a stock with exceptional price potential – a strong balance sheet, excellent growth prospects in a booming industry, and a history of solid execution.

HMS Holdings (HMSY)

HMS Holdings Corp recently hit 52 week highs. The company provides cost containment and coordination of benefits to government healthcare programs. The administration and cost containment of healthcare benefits in the United States has become an increasing concern for government agencies. The outsourcing service market for this activity has experienced solid growth over the past years, which is expected to continue into the future.

HMS Holdings is experiencing increasing analyst coverage, normally a positive sign for a company. Bank of America Securities recently initiated coverage.

The company has an $850 million market cap with minimal debt, solid cash flow, and recent revenue of $138M. The trailing P/E of 70 and forward P/E of 45 shows that the firm is handsomely valued, however the recent quarterly revenue growth (78.7%) and earnings growth support these high expectations.

HMSY has a history of increasing guidance in its conference calls as it did in the recent Q3 call when it announced raising the 2008 full year revenue guidance to $170 million, an increase of 17.2% above 2007 guidance, and adjusted EBITDA to $49 million, an increase of 22.5% over 2007 guidance.

HMS Holdings has to navigate a maze of government regulations while providing coordination of benefits and cost containment to agencies, however this is a service that the government very much needs and the firm is excellent at providing. With the U.S government continuing to increase this type of outsourcing activity, the potential for HMSY stock looks bright.

Sigma Designs (SIGM)

Sigma Designs, Inc. is best known as maker of microprocessors for digital media products such as DVD players, set-top boxes and high-definition televisions. The company has a dominant market share in IPTV and HD DVD; these two markets are expected to explode over the upcoming years as more video is provided over the Internet and the United States broadly rolls out high definition television.

Sigma Designs faces growing competition from other players such as Broadcom Corp. (BRCM) and Zoran Corp. (ZRAN). However these competitors have not eaten into their growth or margins. Sigma Designs reported third-quarter sales of $66 million, a 56% sequential growth, easily trouncing Wall Street projections.

The company has reasonable P/E ratios (trailing: 26.74 / forward: 14.9), excellent earnings growth, no debt, a growth estimate over 29%, and a market cap of $1.14 billion. For a technology company in hot market segment, it is hard not to view Sigma Designs as an exceptional value. A recent company investor presentation can be found at Sigma Designs Investor Presentation – Jan 2008.

Synchronoss Technologies (SNCR)

Synchronoss Technologies is more than just an iPhone activation story. The iPhone release was a great setting for Synchronoss to demonstrate to mobile carriers what it is capable of doing. This is likely to prime the pump for many other carriers to pick up their on-demand, multi-channel transaction management solution technology.

With the iPhone activations fueling it, AT&T (T) generated 78% of the firm's revenue in the recent quarter, so diversification of revenue source is a significant concern for investors in this company. Making inroads in the carrier market takes time; however Synchronoss is seeing traction with Clearwire, Cablevision, and Vonage (VG). It is expected that the company is also working with overseas carriers such Deutsche Telekom's T-Mobile, France Telecom's (FTE) Orange, and Telefonica's (TEF) O2 on rollouts of the iPhone in foreign markets.

For the third quarter, Synchronoss reported net income of $8 million, or 24 cents per share, compared with $3.1 million, or 10 cents per share, last year. Quarterly revenue jumped to $34.5 million from $18.9 million. The company has a market cap of $736M, minuscule debt, a forward P/E ratio under 25, good cash flow, and a history of excellent earnings growth in 2007.

The long term success of Synchronoss is dependent on its ability to penetrate other carrier accounts beyond AT&T with its management technology. Investors should focus on announcements of additional carriers deploying the solution. Assuming that SNCR makes these inroads, the stock price is likely to climb significantly from the current levels.

Synaptics Incorporated (SYNA)

Synaptics Incorporated develops user interfaces for mobile devices like notebook computers and cell phones. Dominating the market, Synaptics makes 60% of all touch pads for portable computers and has a customer list which includes 9 of the top 10 notebook vendors. IDC has forecasted annualized growth of 16.1% for notebook PCs from now until 2010. Synaptics also has excellent presence in the handheld market, including design wins for Apple (AAPL) Nano & Classic iPods and several new smartphones.

Synaptics recently endured an analyst downgrade from American Technology Research analyst Jeff Schreiner who downgraded the stock to "Neutral" from "Buy’ citing a slight loss in market share and the expectation of lower 2008 revenues. This drove the stock to a recent low of near $30, making the pricing attractive.

The company shows a trailing P/E of 25.89 and forward P/E of 10.43 leading to a small 0.83 PEG ratio. Both ratios are small for a tech sector stock. With low debt of $125M, a market cap of $950M, respectable cash flow, and history of earnings growth, SYNA has solid prospects.

The crucial question will be if the company can maintain its user interface market share dominance while growing sales at an exceptional rate over the upcoming couple of years. Assuming the company will hit or exceed the analyst projections; the stock price has significant potential to increase from the current levels.

Summary

As always - investing in small caps involves risk. Not all projections for colossal growth always pan out. Some small cap stocks will turn into the next “10-Bagger” which you will brag to your friends about for years, while others will fade into oblivion. The key is to screen for potential candidates, investigate them fully, and spread your “bets” across several stocks when seeking over-sized growth. There are never any sure winners, but solid research can put the market edge in your corner.


Disclosure: The author does not have a position in any of the equities mentioned in this article. The information provided does not constitute a solicitation to buy, or an offer to sell securities.

Thursday, January 10, 2008

Will 130-30 Funds take flight?

The interest in 130-30 fund concept continues to grow. Many mutual fund families have added 130-30 funds to their portfolio over the past year.

The “130-30” funds allow managers to short-sell up to 30% of their portfolios, and use the proceeds to buy an extra 30% long. The funds both use leverage and short, attributes which are usually embraced in hedge fund products rather than mutual fund offerings.

Conceptually the fund manager would go long strong stocks while shorting weaker stocks. The expectation is the mutual fund would outperform the market and generate excess alpha for investors. Other possible strategies include merger and instrument arbitrage. One of the concerns raised is how would the industry benchmark the performance of this type of fund.

A recent paper, by Andrew Lo of the Massachusetts Institute of Technology and Pankaj Patel of Credit Suisse, puts forward a proposed 130-30 index. The index uses a number of fundamental and momentum factors to access stocks. Those with the best scores are included in the index as longs and those with the weakest scores as shorts. The research defines a “dynamic bench-mark consisting of a plain-vanilla" 130/30 strategy”.

Note the HingeFire stock screener is excellent tool for identifying stocks utilizing the fundamental and technical criteria used in the type of model outlined in this paper. The model uses fundamental criteria such as P/E, P/S, and P/B as well as technical criteria such as Money Flow, MACD, and RSI. The HingeFire stock screener is one of the few products that offers a full complement of fundamental and technical indicators.

Naturally there are questions whether the type of mechanical approach proposed in the “130/30: The New Long-Only” paper actually represents a valuable index, or is simply another stock picking strategy. This leads to immediate questions about the value of comparing the returns of any particular 130-30 mutual fund against this index. There is an expectation that the market will either accept or reject the dynamic index model over time as the new 130-30 funds become more popular.

Tuesday, January 1, 2008

Happy New Year from HingeFire

I want to wish everyone a happy and healthy 2008!

The "Screening to Win" series about technical indicators has recently been presented in the HingeFire blog. With the recent addition of the Bollinger Band summary the series is complete.

The articles detail how to use technical indicators to enhance your investing. Hopefully these summaries will provide traditional fundamental investors with some solid insight on how to incorporate technical indicators to improve their returns. An index of the articles is provided below:

Screening to Win: Moving Averages

Screening to Win: RSI (Relative Strength Index)

Screening to Win: Fast and Slow Stochastic

Screening to Win: MACD (Moving Average Convergence / Divergence)

Screening to Win: MFI (Money Flow Index)

Screening to Win: Williams %R

Screening to Win: Bollinger Bands

A Few Days left to Win an iPod

For HingeFire screener users, there are just a couple days left to qualify for the iPod before the drawing. A drawing to win an iPod will be held on Janurary 5th for those who complete the user survey. One of the benefits of being a HingeFire user is that you get to drive the future development directions for the product. Please take the survey found at: http://www.hingefire.com/user-survey.html

The survey only takes about 20 minutes and all users who take the survey are added to a drawing for an iPod! We look forward to your feedback!

Friday, December 28, 2007

Screening to Win: Bollinger Bands

The overview below describes one of the common technical indicators – Bollinger Bands and provides insights on how to utilize it in your stock selection. Hopefully this outline will provide traditional fundamental investors with some solid insight on how to incorporate technical indicators into their screening. The free HingeFire Stock Screener which can be found at http://www.hingefire.com is one of the few tools available that includes a wide selection of fundamental and technical criteria for selecting stocks. Using a combination of fundamental and technical screening is a powerful tool for winning in the market.

Bollinger Bands

Bollinger Bands Overview


Bollinger Bands were created by John Bollinger in the early 1980s. The intention of Bollinger Bands is to allow the dynamic comparison of volatility and associated price levels over time.

Bollinger Bands are created by taking a 20 day SMA average and then placing two bands, one above and the other below, at two standard deviations away from the central SMA line. These bands are drawn on the same chart as the stock price.

The lower Bollinger band normally marks a support level while the upper band defines resistance. Many times a dropping or rising price level only crosses outside the bands for a single day. In some sense most stocks are not more volatile than the bands associated with Bollinger, any price outside the band is likely to quickly revert to a level inside. One exception are situations in which the equity price is quickly rising and falling, and the bands “open up” as the volatility increases.

The HingeFire tool provides support to incorporate Bollinger Bands in your creation of screens for stocks. Users can scan to find stocks whose prices are at extreme and unsustainable short-term levels. The HingeFire screener can uncover stocks that are outside the upper and lower Bollinger Bands, as well as those where the price has just crossed these levels in either direction.

How to use Bollinger in screening

Most investors utilize the crossovers above the upper Bollinger Band or below the lower Bollinger Band when screening with the indicator. Bollinger crossovers represent volatility extremes, and usually imply that the price will snap back shortly. Many times these serve as excellent short-term entry points when confirmed with other indicators.

Another common method to screen with Bollinger is to scan for stocks that are outside the upper and lower bands. This will catch stocks that have been in these extremes for more than a single day.

Crossing above the upper Bollinger

The upper Bollinger Band serves as a resistance level. Stocks whose prices rise above this level tend to snap back below it, many times in under a single day. This is especially true in situations where the bands do not “open up” due to increased volatility. If the Bollinger Bands remain steady in width then if is likely that the price increase above the upper band is short lived.

AANB (Abigail Adams National Bancorp Inc.) crossed above the upper Bollinger Band. Note that the bands are not widening, but have remained fairly static in width over time. It is likely that this price rise outside the upper band over the $11.62 level will not last. The normal expectation will be for the closing price to drop below the band shortly. To many investors this would serve as an indicator that they should wait before entering long, and only consider a short-term short position as the current price levels.

Crossing below the lower Bollinger

The lower Bollinger Band acts as a support level. Normally when the price of a stock falls below the lower band, it tends to revert back above it. The cross below is of interest because this event many times lasts only a single day and serves as a good long entry point in some situations.

GWR (Genesee & Wyoming Inc.) dropped below the lower Bollinger Band today when the price closed at $24.78. The width of the bands has not changed greatly over the past couple of months after widening after the drop in November. The current drop started in early December starting near the upper band and now possibly ending after crossing the lower band. Assuming the information cross correlates with other technical and fundamental indicators, this may serve as a good entry point for a long investor.

Price above upper Bollinger

Sometimes the price can rise above the upper Bollinger Band for several days before retreating to inside the band. This usually occurs in scenarios where the band rises and widens with the increase in the stock price and volatility.

EEQ (Enbridge Energy Management LLC) rose outside the upper Bollinger Band for several days in early November. The closing prices remained outside the band for five days as the stock price rose and the Bollinger Band widened. Eventually the stock price peaked and reverted below band. Some investors screen for situations where the stock price is above the upper Bollinger Band, pull up the charts, and then implement short trade entries after the price action peaks out.

Price below lower Bollinger

In some situations, the price of a stock can drop below the lower Bollinger Band for several days. This usually occurs in scenarios where the stock price is in free-fall and the band widens to accommodate the increasing volatility. Normally the price will revert inside the band after a few days when the selling momentum dissipates.

A recent scan using the HingeFire tool found that WYE (Wyeth) dropped below its lower Bollinger Band for the past three days. The band has opened up in the direction of the price drop and widened. As with many situations, the recent drop in Wyeth is a news driven event, the market has concerns about potential generic competition with one of it leading patent-protected drugs. Usually these types of news stories only hold the price down for a short period of time. A patient investor would monitor this situation and wait for an opportunity to put on a long position if they believe the fundamentals of the company are sound.

Bollinger Summary

By themselves, Bollinger Bands do not normally generate pristine buy and sell signals. It is best to cross correlate information from Bollinger with other technical indicators before taking action. On a chart, Bollinger Bands are excellent for identifying periods of high and low volatility, as well as extreme pricing levels.

Many investors utilize Bollinger to look for divergences in stock price and the volatility of the bands. A small number of investors try to set different Bollinger periods and standard deviations on charts to match the particular equity under evaluation. However the traditional 20 day Bollinger with two standard deviation bands is normally the best for intermediate term studies.

The HingeFire tool supports users in screening for the following situations with the Bollinger Band indicator:

  • Crossing above the upper Bollinger.
  • Crossing below the lower Bollinger.
  • Price above the upper Bollinger.
  • Price below the lower Bollinger.

Combining technical indicators such as Bollinger Bands with commonly used fundamental criteria and technical indicators when selecting your investments helps put the market edge in your corner. The Bollinger support in the HingeFire Stock Screener adds a powerful tool that enables the searching for volatility-related extremes which will improve the timing of your market transactions.

Tuesday, December 11, 2007

Screening to Win: Williams %R

The overview below describes one of the common technical indicators – Williams %R and provides insights on how to utilize it in your stock selection. Hopefully this outline will provide traditional fundamental investors with some solid insight on how to incorporate technical indicators into their screening. The free HingeFire Stock Screener which can be found at http://www.hingefire.com is one of the few tools available that includes a wide selection of fundamental and technical criteria for selecting stocks. Using a combination of fundamental and technical screening is a powerful tool for winning in the market.

Williams %R

Williams %R Overview


The Williams %R was created by Larry Williams, and is useful for identifying overbought and oversold conditions in the market. The indicator shows the relationship of the current close in relation to the high-low range over a fourteen day period of time

Values above 80 are considered oversold while values below 20 are considered overbought. Note that this is the exact opposite of most oscillators that utilize a scale of 0 to 100.

The Williams %R Indicator is normally plotted inversely with 100 at the bottom and 0 at the top of the vertical axis. This is reverse of most oscillator graphs. Some charts present the indicator as running from -100 to 0

By the nature of its formation, the Williams %R indicator is generally quite choppy and active. Many times it will provide false signals, which is why investors should look for confirmation from charts or other indicators before entering a transaction.

The HingeFire tool provides support to incorporate Williams %R in your creation of screens for stocks. Users can scan to determine if the Williams indicator is greater than or less than the key 20 (overbought) and 80 (oversold) levels, and also establish if the Williams %R value has just crossed above (JCA) or below (JCB) these thresholds.

How to use Williams %R in screening

Most investors utilize the crossovers from Overbought and Oversold conditions when screening with the Williams %R indicator. Unlike other oscillators, many times crossing into an extreme is of interest rather then just crossing out of it.

Many times the Williams indicator demonstrates price pressure on the edge of an extreme leading to a cycle of higher or lower prices in the direction of the prevailing trend for the period of time. This leads investors to screen for just crossing into extremes below 20 (overbought) or above 80 (oversold); as well as crossing out of these conditions.

Crossing into oversold

Stocks crossing above 80 are considered oversold with Williams %R. Many stocks cross above this threshold and continue in the direction of the prevailing trend for considerable periods of time. Many investors correlate the cross into oversold territory with other technical indicators and use the combination to gauge short-term price momentum.

MFRI (MFRI Inc.) recently crossed again into oversold territory under 80 (plotted at the bottom). The previous cross into oversold territory on October 22nd led to a significant slide in the price of the stock over several weeks. The recent crossover could be setting the table for a similar occurrence.

Crossing into overbought

Stocks crossing below the 20 threshold are considered overbought in the Williams %R indicator. Many times crossing below this level can be a sign that the price increases may continue for a several week period of time; therefore many investors screen for this occurrence.

A fairly volatile stock APFC (American Pacific Corp.) had recently crossed below the 20 level placing it in overbought territory. The earlier cross below this level at the beginning of October demonstrates that this can many times herald the start of a short-term period of price increases while Williams %R remains below the 20 threshold (plotted at the top)

Crossing out of oversold

Many times excellent opportunities exist when the Williams %R indicator crossed below the 80 threshold indicating the stock is not longer oversold. Most traders correlate this change with other technical indicators to confirm the new trend. Some investors wait until the Williams oscillator crosses the 50 mark before acting on a trend reversal. The Williams %R indicator is choppy by nature and can easily reverse after crossing below extremes which is why it is important to wait for the new trend to develop.

A recent HingeFire screen found that DRIV (Digital River Inc) has just crossed below the 80 level exiting the oversold condition. Correlation with other indicators may indicate that the new trend of increasing prices rising is likely to remain in place for several weeks.

Crossing out of overbought

Another trend reversal scenario occurs when the Williams %R indicator crossed above the 20 level indicating the stock is no longer overbought. Correlation with other technical indicators often indicates opportunities where the price is likely to continue to drop in price over a several week period. This can enable investors to time solid entry points at short term troughs in price or look at shorting scenarios.

FUQI (Fuqi International Inc.) held its IPO in November. Since this time the stock has traded in a range of $6 to $11.50. Recently the Williams %R crossed above the 20 threshold exiting the overbought condition. Since this time the price of the stock has dropped by more then two dollars.

Williams Summary

Williams is similar to the stochastic indicator, however the 14 days Williams %R tends to be more choppy. This leads at times to false signals regarding trend reversals and breakouts; on the positive side the Williams indicator tends to be quick and does not lag greatly. This all gets back to a regular theoretical discussion regarding signal quality versus speed. Overall, it is important to use other technical indicators to confirm the action in the Williams %R before performing transactions.

Many investors use a 28 day version of Williams %R in charts for a smoother version with less false alerts.

The HingeFire tool supports users in screening for the following essential situations with the Williams %R Indicator:

  • Crossing into oversold – Williams crossing above 80.
  • Crossing into overbought – Williams crossing below 20.
  • Crossing out of oversold – Williams crossing below 80.
  • Crossing out of overbought – Williams crossing above 20.

Combining indicators such as the Williams %R Index with other technical indicators enables investors to properly time entrance and exit opportunities in the market. The Williams Indicator support in the HingeFire Stock Screener combined with other fundamental and technical criteria provides a powerful tool to uncover prospects that can enhance your portfolio.